The Modern Endowment Story: A Ubiquitous United States Equity Factor
Ennis (2021a) evaluated the performance of educational endowment funds in the United States through June 30, 2020. The principal focus of that article was the performance of large endowments.[1] Ennis (2021b) critically examined the efficacy of the so-called endowment model. This paper explores asset allocation trends since the Global Financial Crisis of 2008 (GFC) and during more recent years, which I refer to as the Modern Era. It updates the evaluation of endowment performance through June 30, 2021. It examines the cost of investing and its likely impact on performance. Finally, it identifies important strategic issues for endowment managers to consider.
PRIOR WORK
Ennis (2021a) evaluated the performance of educational endowments in the United States over the 47 years from 1974 to 2020. It identified three distinct eras of excess return of the NACUBO composite of large endowments relative to passive investment.[2] Exhibit 1 summarizes the results. In the first era, endowments invested nearly exclusively in stocks and bonds, with stocks being primarily those of US companies. The second era was the Golden Age of Alternative Investments, when private equity, venture capital, real estate, and hedge funds produced extraordinary returns. The Golden Age ended with the GFC, when a third era emerged.
Exhibit 1
Three Eras of Endowment Performance (fiscal years [FYs] 1974–2020)
|
Era |
Years in Duration |
Annualized Excess Return |
|
Stock and Bond Era (FYs 1974–1993) |
20 |
-0.8% |
|
Golden Age of Alternative Investments (FYs 1994–2008) |
15 |
+4.1 |
|
Post-GFC Era (FYs 2009–2020) |
12 |
-1.6 |
The main emphasis of Ennis (2021a) was on endowments’ performance during the latter (post-GFC) era. Regressing returns of the endowment composite on those of a stock and bond benchmark of comparable risk for the 12-year post-GFC era yielded an R2 of 0.985 and a tracking error of 1.5%.[3] A key finding of that research was that stocks and bonds alone explained the performance of endowment funds for all intents and purposes; alternative investments did not serve as diversifiers. The alpha (regression intercept) of the composite relative to the stock–bond benchmark was -1.46%, with a statistically significant t-statistic of –2.7. That study also revealed that alternative investments had a significantly adverse impact on fund performance relative to portfolios comprising solely marketable securities. A follow-up article (Ennis 2021b), titled “The Failure of the Endowment Model,” determined that the model itself had become dysfunctional, ceasing to provide hoped-for diversification benefits and significantly underperforming passive investment since the GFC.
This paper identifies a ubiquitous equity factor in the returns of the principal asset classes used by large endowments. It updates performance evaluation results through June 30, 2021. The paper explores recent trends in asset allocation that have unfolded during what I refer to as the Modern Era—the most recent 5–7 years. Finally, the paper highlights important strategic issues for the consideration of endowment trustees and managers.
THE UBIQUITOUS EQUITY FACTOR
Endowment managers pride themselves on the extensive diversification of their portfolios, investing in a number of alternative investment types. In my prior work (Ennis, 2020, 2021a and 2021b), however, I was unable to find evidence that alternative investments contribute meaningfully to portfolio diversification. Here I take a different tack: I seek to determine what factor or factors have, in fact, animated the returns of endowment portfolios. The answer to this question was not difficult to apprehend. Exhibit 2 shows the relationship of the US equity factor with the returns of the principal asset classes used by endowments.[4] With the exception of investment-grade bonds, all the asset classes exhibit meaningfully positive correlation with the Russell 3000 stock index, my proxy for the US equity factor; most of them exhibit a very high degree of correlation with it. That correlation manifests itself in asset class betas ranging from 0.25 to 1.16 relative to the US equity factor; the betas, in turn, are drivers of return. The overall effect is evident in the statistics for the NACUBO composite itself: It has exhibited a beta of nearly 0.8 with the US stock market over the 13-year period by virtue of its near perfect correlation with it. And thus, the US equity factor reveals itself as the prime driver of endowment returns.
Exhibit 2
Correlation and Beta Relative to Russell 3000 Index (13 years ending June 30, 2021)
|
Asset Class |
Correlation Coefficient with Russell 3000 Stocks |
Beta Relative to Russell 3000 Stocks |
|
Aggregate Bonds |
-0.47 |
-0.10 |
|
High-Yield |
0.56 |
0.25 |
|
Non-U.S. Equities |
0.96 |
1.07 |
|
Non-US Equities (hedged) |
0.94 |
0.79 |
|
Real Estate |
0.85 |
0.83 |
|
Venture Capital |
0.80 |
1.16 |
|
Private Equity |
0.96 |
1.00 |
|
Hedge Funds |
0.96 |
0.45 |
|
NACUBO Composite |
0.98 |
0.79 |
Fixed income provides an interesting case study of the ubiquitous nature of the US equity factor. The Aggregate (investment-grade) bond index appears in Exhibit 2 with a negative beta relative to stocks, reflecting the negative correlation of the two. It is an indication that high-quality bonds were a good diversifier vis-à-vis US equities in this period. The size and character of institutional fixed-income portfolios have evolved considerably in recent decades. In days gone by, fixed-income portfolios made up 30% or more of institutional portfolio assets and were reliably investment grade in terms of their creditworthiness. But large endowments’ fixed income allocations have steadily declined. NACUBO reports an average allocation (including cash of 4%) of just 11% in 2020. At the same time, as keen observers of institutional investing know, there has been a trend to introduce meaningful amounts of credit (default) risk into the fixed-income portfolio. In view of the resulting downgrading of fixed income, I included high-yield bonds, with an equity beta of +0.25, in Exhibit 2 to highlight that the equity factor even bleeds into the fixed income portfolio.
The theme of a ubiquitous equity factor runs through the balance of this paper.
PERFORMANCE
Returns of the NACUBO (equal-weighted) composite of large endowments are the subject of analysis that follows. Returns are for the endowments’ annual fiscal years, ending June 30 of each year. The composite comprises more than 100 endowments with assets of greater than $1 billion, which have an average of more than 100 managers each.[5] I begin by determining the effective asset allocation of the NACUBO large fund composite for the 13 years ending June 30, 2021. To do this, I use the returns-based, constrained multiple regression analysis à la Sharpe (1988, 1992), often referred to as returns-based style analysis (RBSA).[6] RBSA seeks to identify a benchmark that yields a fair economic return for a portfolio, or a composite of them, as in the present case. It identifies the effective exposure of a return series to various market indexes for a particular time period by minimizing regression residuals. In this respect, RBSA identifies the combination of market indexes that has the best statistical fit with the subject series. This becomes the performance measurement benchmark.
The asset class indexes I initially make available as independent variables in RBSA are:
- US investment-grade bonds—Bloomberg US Aggregate Bond Index
- US common stocks—Russell 3000 Stock Index
- Unhedged non-US stocks— MSCI ACWI ex USA Index
- Hedged non-US stocks— MSCI ACWI ex USA Index (hedged)
- Private market real estate—Cambridge Associates Real Estate Index
- Venture capital—Cambridge Associates Venture Capital Index
- Private equity—Cambridge Associates Private Equity Index
- Hedge funds— HFRI Fund of Funds Composite Index
In a separate analysis, I limit the independent variables to public market indexes for US stocks and bonds and non-US stocks. Exhibit 3 summarizes the RBSA results for both specifications of the model. The advantage of using the full palette of market indexes is a much tighter fit of the regression equation, which explains virtually all (99.9% of) the variance of the composite. The advantage of the four-index model is conceptual in nature. The broad stock and bond indexes in the more parsimonious model are transparent and investable. There is nothing hypothetical about them, whereas the alternative asset indexes are much more nebulous. In addition to their not being investable, we have no way to know if they are valid: They represent someone’s less-than-comprehensive compilation of selected (unidentified) investors’ experiences. Fortunately, the resulting alphas are similar, with a four-index alpha of -2.24% and a six-index alpha of -2.5%.[7]
Exhibit 3
Comparison of Alternative Benchmark Formulations
(13 years ending June 30, 2021)
|
Asset Class |
Benchmark Percentages with Alternative Investments |
Benchmark Percentages with Stocks and Bonds Only |
|
Aggregate Bonds |
17% |
16% |
|
US Equities |
21 |
69 |
|
Non-US Equities |
7 |
— |
|
Non-US Equities (hedged) |
11 |
15 |
|
Real Estate |
— |
— |
|
Venture Capital |
4 |
— |
|
Private Equity |
39 |
— |
|
Hedge Funds |
— |
— |
|
|
|
|
|
Key Statistics |
|
|
|
Beta of Composite to Benchmark |
1.0 |
1.0 |
|
R2 |
99.9% |
96.7% |
|
Tracking Error |
0.42% |
2.61% |
|
Intercept (Alpha) |
-2.50% |
-2.24% |
|
t-statistic |
-16.4 |
-2.4 |
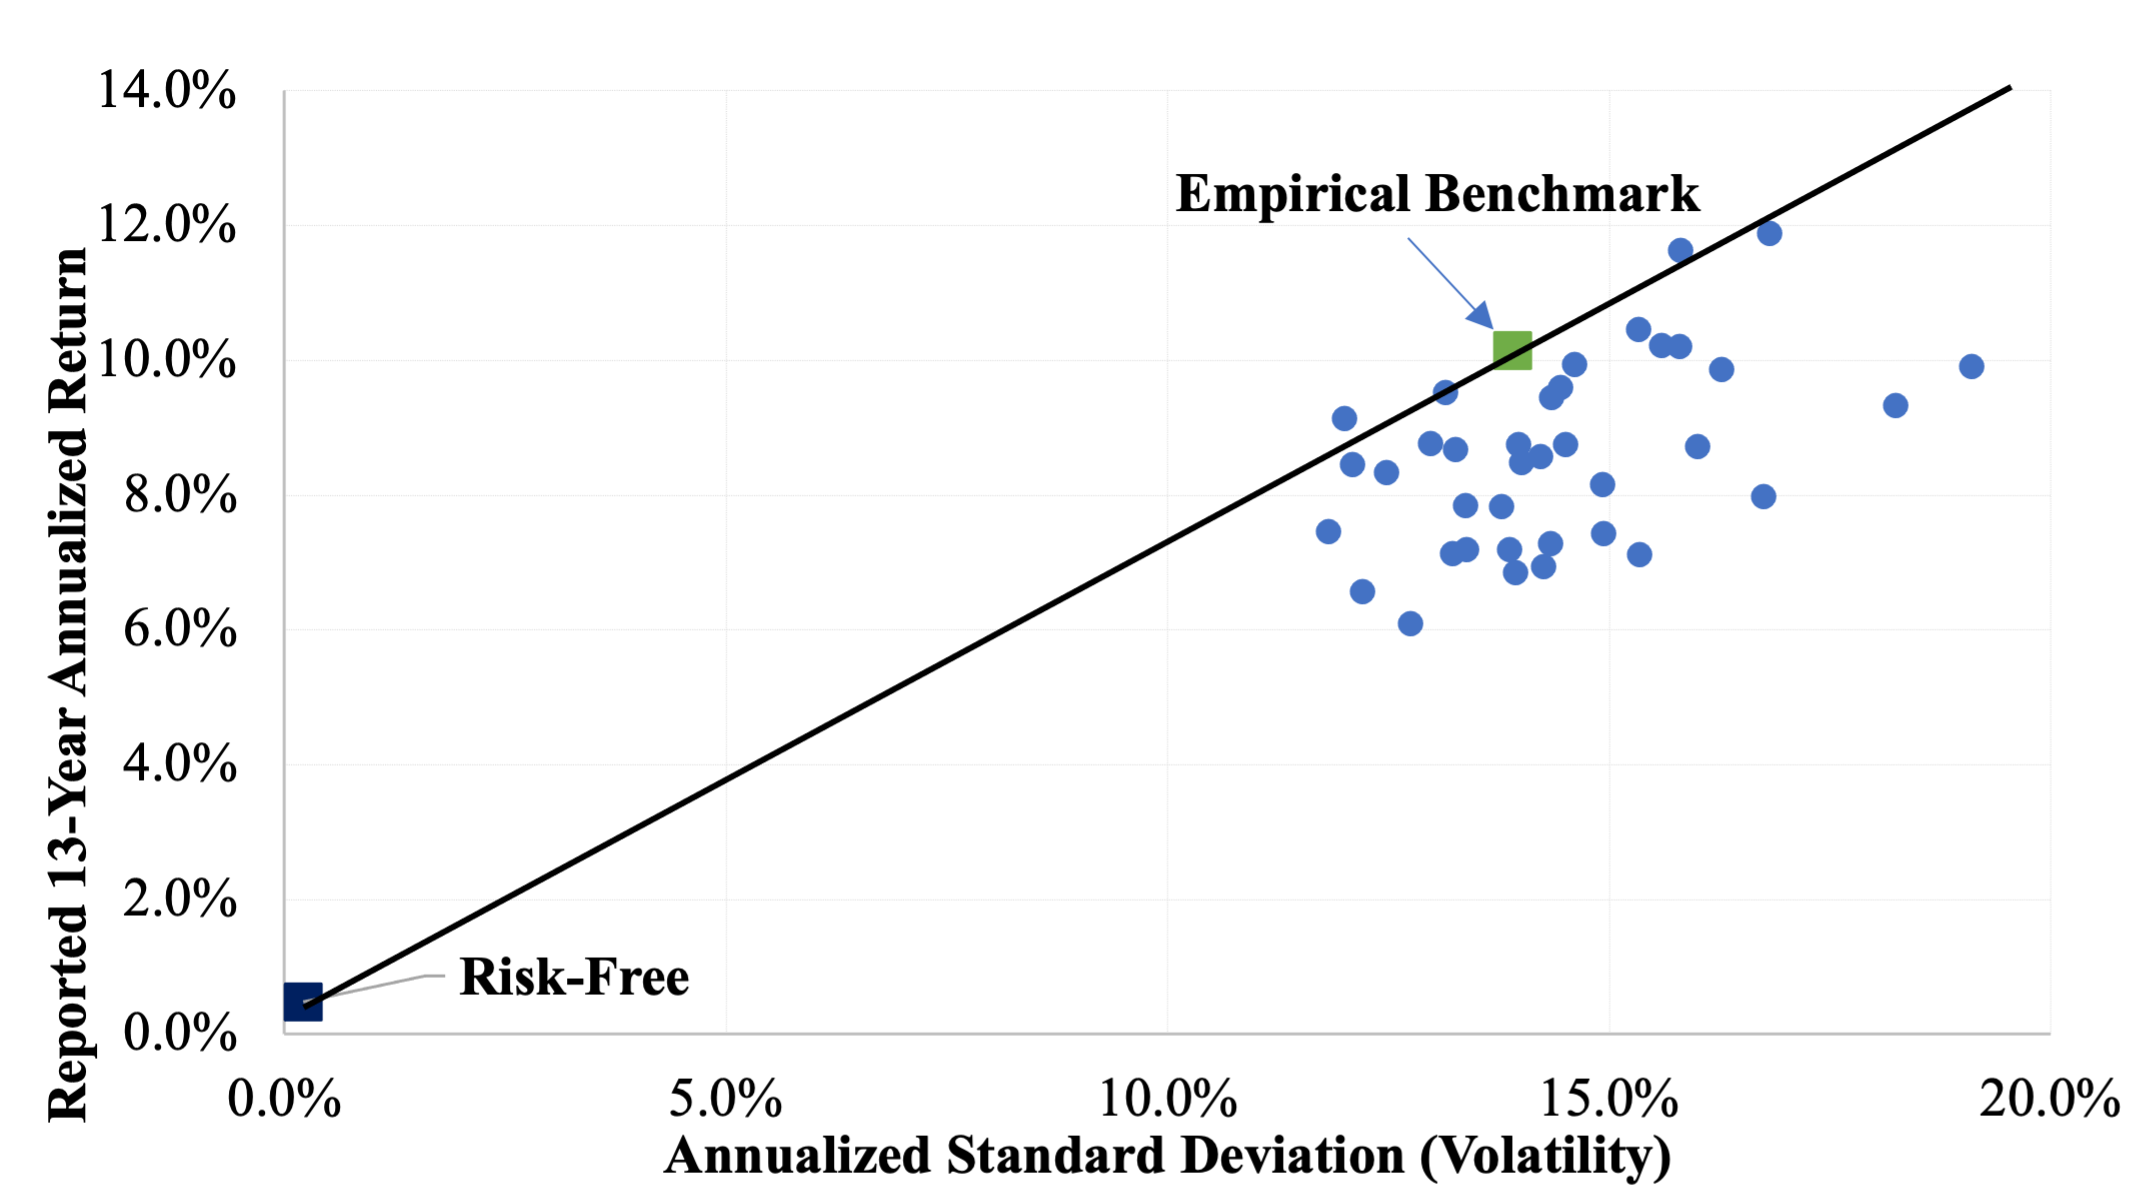
Exhibit 4 provides return, risk and performance statistics (Sharpe ratios) for 37 individual endowments with assets greater than $1 billion over the 13-year study period.[8] Sharpe ratio is return in excess of the riskless rate divided by standard deviation of annualized return. The benchmark results in Exhibit 4 are for the stock-and-bond-only benchmark shown in Exhibit 3, which is a passively investable combination of broad market indexes that mimics the fluctuations of the full composite over time. Only two of the 37 endowments — 5% of them — have a Sharpe ratio greater than that of the benchmark, and those two do so by the slimmest of margins. The rightmost column indicates the incremental return each endowment would have required to realize a Sharpe ratio equal to that of the benchmark. The endowment returns do not reflect the deduction of the cost of operating the schools’ investment offices, which I estimate range from 25 bps to 75 bps of endowment value. Had returns been net of these expenses, it is likely that none of the endowments would have had a Sharpe ratio greater than that of the passive benchmark. Noteworthy is the fact that the endowments are free to depart from the public markets in portfolio construction, and, in fact, have an average of 60% in alternative investments. Exhibit 5 shows the same results graphically.
Exhibit 4
Risk and Performance Statistics for Individual Endowments (13 years ending June 30, 2021)
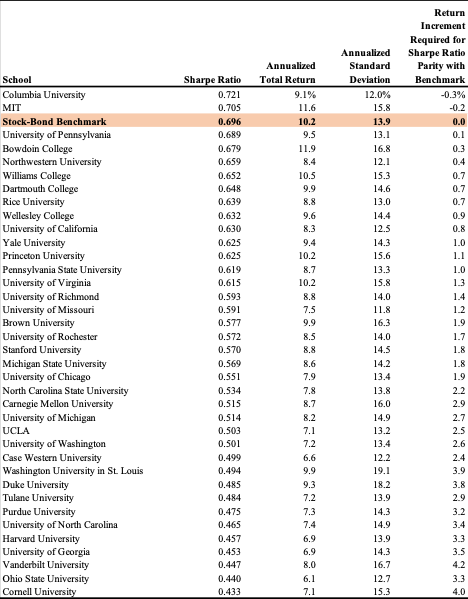
Exhibit 5
Endowment Return versus Risk (13 years ending June 30, 2021)
Summary: The endowment composite underperformed a passively investable benchmark by 2.24% per year over the 13 years of the study. Ninety-five percent of the endowments in a sample of 37 have risk-adjusted performance worse than the same benchmark. How can the performance of these sophisticated investors, collectively and individually, be so poor?
COST
I estimate that the typical cost of investing large endowments is approximately 2.5% of asset value annually, with alternative investments accounting for more than 90% of the total. The estimate is based on (1) research into the cost associated with investing in various asset classes (e.g., private equity, hedge funds, private market real estate, private debt, commodities) as well as in public markets,[9] and (2) the average asset allocation percentages for large endowments published by NACUBO. See Exhibit 6 for a summary of the development of the estimate. This is admittedly a rough estimate, limited by the absence of actual cost data for the endowments and, therefore, reliant on academic and other research into cost by asset class. The cost estimate of approximately 2.5% of asset value annually is similar to the observed margin of underperformance of 2.24% to 2.5% a year. Given the extreme diversification of the composite, which comprises more than 100 large endowments with an average of more than 100 investment managers each, and with its near perfect correlation with market indexes, there is every reason to believe that cost is the principal reason for endowments’ poor performance.
Exhibit 6
Endowments’ Estimated Annual Cost as a Percent of Asset Value
|
Asset Class |
Allocation Percentage |
Cost as a Percent of Invested Value |
Extension |
|
Fixed Income |
5.3% |
0.2%[10] |
0.01% |
|
Equities |
31.0 |
0.4 |
0.12 |
|
Real Estate |
6.2 |
2.3[11] |
0.14 |
|
Venture Capital and Private Equity |
25.5 |
6.0[12] |
1.60 |
|
Hedge Funds |
21.1 |
3.0[13] |
0.63 |
|
Other Alternatives |
1.0 |
1.0 |
0.01 |
|
Cash |
3.9 |
— |
— |
|
Total |
100% |
— |
2.51% |
Figures may not sum to 100% because of rounding.
Source of asset allocation percentages: NACUBO — https://www.nacubo.org/Research/2021/Public-NTSE-Tables
ENDOWMENTS WITH RISK RISING, EMBRACING THE US EQUITY FACTOR
I find indications that large endowments’ effective equity exposure has risen in recent years, with increasing emphasis of the US market. I estimate the effective equity exposure of the composite at 84% when applying RBSA to the composite for the full 13-year period.[14] See Exhibit 7. I shorten the time period by dropping the most distant year, repetitively. I refer to the most recent 5–7 years in Exhibit 7 (shaded section of the table) as the Modern Era. In winnowing the return history to the Modern Era, the effective equity exposure increases to 97%, entirely in the US market. (I believe the persistent 3% allocation to bonds captures the presence of frictional cash that is attendant management of complex portfolios of assets with limited liquidity.[15]) The endowments, collectively, appear to have become decidedly more aggressive in terms of their equity exposure during the Modern Era, with predominant exposure to US equities.
Exhibit 7
Effective Asset Allocation over Various Time Periods Ending June 30, 2021
|
Most Recent n Years |
Bloomberg Aggregate Bonds |
US Stocks |
Non-US Stocks |
Total Stocks |
Total Assets |
R2 |
Tracking Error |
|
13 |
16% |
69% |
15% |
84% |
100% |
0.967 |
2.6% |
|
12 |
11 |
78 |
11 |
89 |
100 |
0.955 |
2.5 |
|
11 |
11 |
79 |
10 |
89 |
100 |
0.955 |
2.6 |
|
10 |
8 |
92 |
0 |
92 |
100 |
0.971 |
2.1 |
|
9 |
7 |
93 |
0 |
93 |
100 |
0.969 |
2.2 |
|
8 |
5 |
93 |
1 |
95 |
100 |
0.984 |
2.1 |
|
7 |
3 |
97 |
0 |
97 |
100 |
0.997 |
0.9 |
|
6 |
3 |
97 |
0 |
97 |
100 |
0.998 |
0.8 |
|
5 |
3 |
97 |
0 |
97 |
100 |
0.997 |
0.9 |
Exhibit 8 provides the same insight more simply, i.e., without using RBSA to establish asset allocation weights. The first two columns present the standard deviation of return for the composite and for the Russell 3000 over the receding time periods shown in Exhibit 7. The next column shows the ratio of the former to the latter, or the risk ratio of the composite for the period. This is followed by the correlation coefficient for the two series. The last column is the beta. (Beta is the product of risk ratio and correlation.) Owing to the near perfect correlation of the two series over all time periods, the risk ratio and beta rise in lockstep as the latter years are weighted more heavily. Over the longest time period, both figures are approximately 0.8; they increase to near unity (0.97) in the Modern Era. Exhibit 9 shows the same results graphically. Based on this, we can reasonably conclude that large endowments, collectively, have positioned themselves as de facto equity investors.
Exhibit 8
Increasing Endowment Risk
|
Most Recent n Years |
Standard Deviation of Composite Return |
Russell 3000 Standard Deviation |
Risk Ratio |
Composite Correlation with Russell 3000 |
Composite Beta Relative to Russell 3000 |
|
13 |
13.7% |
17.0% |
0.81 |
0.98 |
0.79 |
|
12 |
11.0 |
12.6 |
0.87 |
0.98 |
0.85 |
|
11 |
11.6 |
13.2 |
0.88 |
0.98 |
0.86 |
|
10 |
11.8 |
12.8 |
0.92 |
0.99 |
0.91 |
|
9 |
12.0 |
12.8 |
0.94 |
0.98 |
0.92 |
|
8 |
12.8 |
13.6 |
0.94 |
0.99 |
0.93 |
|
7 |
13.6 |
14.0 |
0.97 |
1.00 |
0.97 |
|
6 |
14.6 |
15.0 |
0.97 |
1.00 |
0.97 |
|
5 |
14.6 |
15.1 |
0.97 |
1.00 |
0.97 |
Exhibit 9
Increasing Endowment Risk
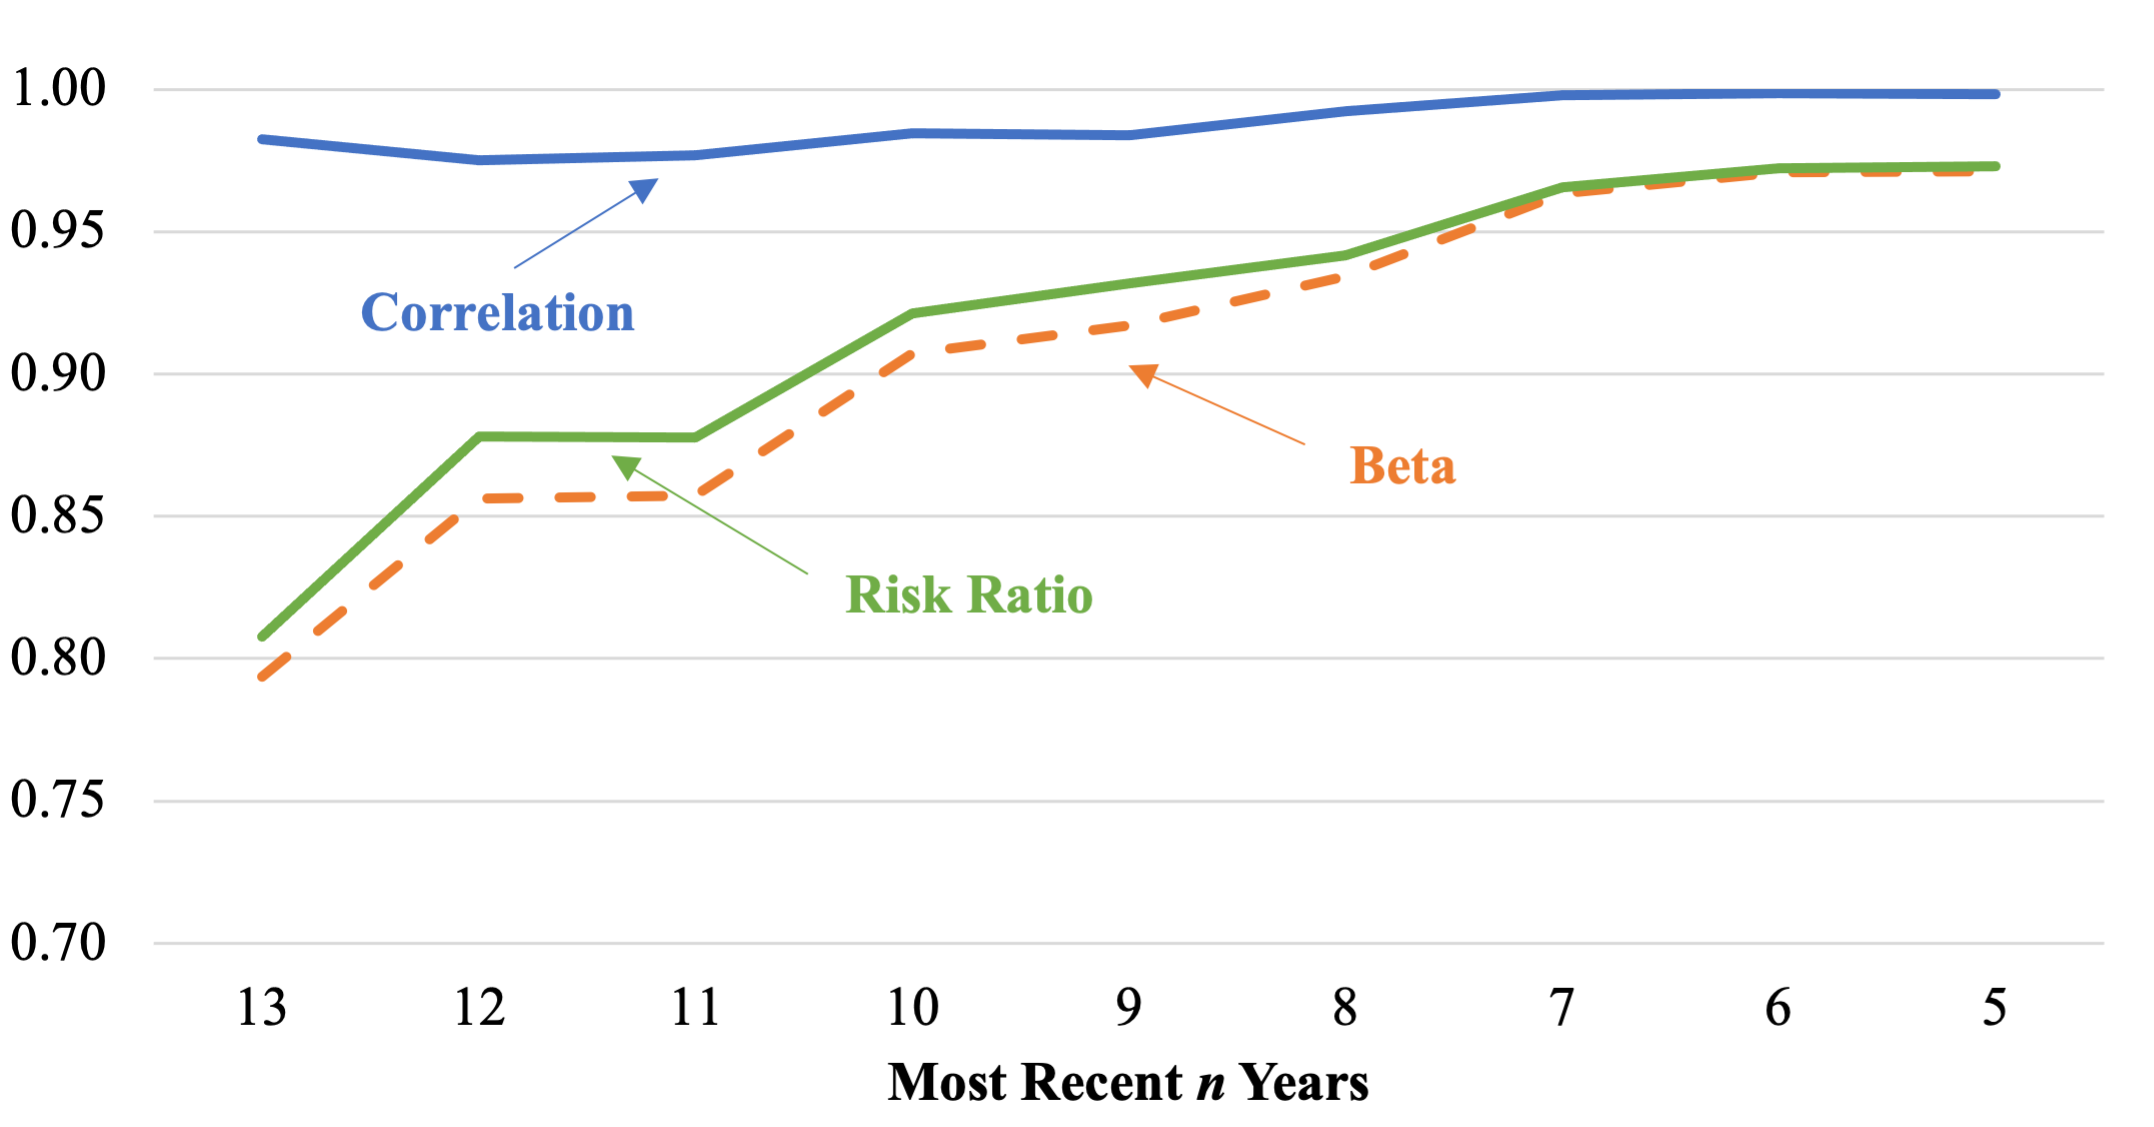
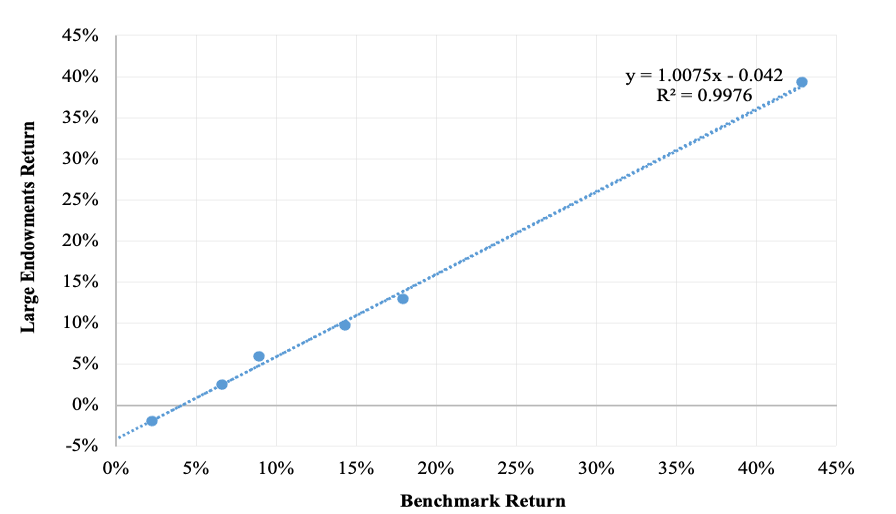
Exhibit 10 shows the results of regressing composite returns on those of a benchmark comprising 97% US equity and 3% investment-grade bonds for the six years ending June 30, 2021. The composite has a beta relative to the benchmark of 1.0 and an R2 of 0.998 (tracking error of 0.8%). Exhibit 10 also indicates an intercept (alpha) of -4.2%. In other words, the composite has fluctuated just like a total US stock market index fund (with 3% cash) during the Modern Era, but has underperformed such a portfolio by 4.2% a year.
Exhibit 10
Regression of Composite Returns on Those of the 97%–3% Benchmark (six years ending June 30, 2021)
OVERALL POLICY AND STRATEGY ISSUES
Risk Tolerance
If the average equity exposure of large endowments is equal to that of the stock market with frictional cash, we can safely conclude that roughly half of the endowments are even more aggressively positioned equity-wise. Contrasting this result to endowments having typically 30% or more of their assets in investment-grade bonds in the not-so-distant past gives rise to the question of risk tolerance. Has the risk tolerance of endowed institutions increased significantly over the past decade or two? Or, in light of an extraordinarily strong US equity market of late, is it an expression of recency bias on the part of endowment managers? Or have those managers been conditioned to believe bear markets do not last long, and that they, and the institutions they work for, can hold their breath, so to speak, until asset values recover from a bear market? This would be a good time for them to review the history and duration of bear markets dating back at least to the Great Crash of 1929 and to reexamine their institution’s risk tolerance.
Home Bias
Home bias, the expressed preference of investors to own the stocks of companies domiciled in their country, is pervasive among institutions as well as individuals around the world. US equities currently account for approximately 60% of the value of the MSCI ACWI. The all-time high percentage for the United States was 70% in 1969. From there it declined to 30% in 1989 with the burgeoning Japanese market. (See Exhibit 11.) As for home bias, US mutual fund investors have 79% of the value of their common stock investments in the US market, according to Vanguard. Large endowments are essentially 100% exposed to the US equity market. I wonder if they are even aware of the extent of their reliance on the home market.
Exhibit 11
Share of Global Equity Market Value for Select Countries and Regions (1969–2019)
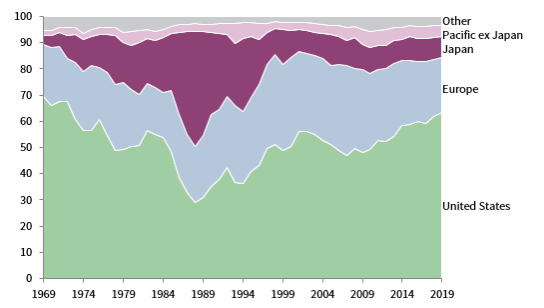
Source: Cambridge Associates (https://www.cambridgeassociates.com/insight/benefits-of-global-diversification/).
The funds’ bias toward the home market takes on added importance in light of the extraordinary valuation level of the US equity market. As of October 29, 2021, Robert Shiller’s cyclically adjusted price-to-earnings (CAPE) ratio for the United States was approximately 39, compared with about 24 for Europe and Japan. At 39, the US CAPE ratio is 2.3 times its long-term average of about 17. (It reached a low of about 13 during the GFC.) And at a CAPE ratio of 39, investors buying US equities are paying 63% more for their earnings than are investors in other principal markets. The endowments are betting heavily on the home market and paying up to do it. The Japanese experience offers a sober reminder that country market diversification matters. Japan’s share of global market value rose from less than 5% to about 40% over the course of two decades, only to fall back to about 6% currently.
SUMMARY AND RECOMMENDATIONS
The endowment model is a thing of the past. Large endowments have been piling into investments that provide sure access to the US equity factor to the virtual exclusion of everything else. Each fund has fashioned its own complex portfolio in its own unique way. But the collective effect is as clear as it is simple: For all intents and purposes, the endowments own the US stock market. They are not, however, getting a competitive return. They have experienced an annual opportunity cost of 2.24% to 2.5% a year since the GFC, which approximates their estimated cost of investing of 2.5% a year. Performance in the Modern Era is even less favorable. These results cast doubt on the ability of investment managers to beat the market before fees, even when they are free to roam from the beaten path.
Here are my recommendations:
- Over and over again in my work, the overarching theme for diversified institutional investors — and all institutional investors are diversified — is that cost is pretty much all that matters. It is axiomatic: The more you pay, the worse you do. These endowments should bring their cost of investing down, way down.
- Endowment managers and trustees should ask whether they have allowed themselves to become caught up in a horse race that jeopardizes their institutions. As stewards of institutional wealth, are they really comfortable with an equity factor exposure of 100% or more, most of which is represented by illiquid or semi-liquid assets?[16]What, in terms of the prospective cash flows of their institutions, has enabled the expression of risk tolerance that we observe, which is markedly more aggressive than it was a generation ago? It is time to revisit the fundamentals of risk tolerance. Endowment managers that do so may discover a greater role for investment-grade bonds in the portfolio.
- Even if institutional stewards are comfortable being all-in equity investors, are they comfortable with such a heavy bet on a single stock market when there are dozens in which they could participate? Are they even aware of the extent of their home equity market and US dollar bias? We all know that the US stock market has clobbered those of the rest of the world since the GFC. The same was true of the Japanese stock market in the years leading up to its collapse. As things stand, the endowments have all their eggs in one basket with a tag that says “Made in America.” Prudence dictates diversifying globally.
Ever since the estimable David Swensen began blazing a trail for endowment managers in the late 1980s, their emphasis has been on being savvy investors in largely illiquid sectors. Textbook investing seemed much less important. My results suggest it may be time to dust off the textbooks.
ACKNOWLEDGEMENTS
I am grateful for the assistance and helpful comments of Anonymous, Mitchell Bollinger, Antti Ilmanen, Donald Keim, Michael Markov, Soeren Fryland Moeller, Ruben Mutsaers, Joseph Pagliari, Ludovic Phalippou, Jason Prole, Trym Riksen, Michael Sebastian, William Sharpe and Barton Waring.
REFERENCES
Ben-David, I., J. Birru and A. Rossi. 2020. “The Performance of Hedge Fund Performance Fees.” SSRN: https://ssrn.com/abstract=3630723 or
http://dx.doi.org/10.2139/ssrn.3630723.
Bollinger, M. A., and J. L. Pagliari. 2019. “Another Look at Private Real Estate Returns by Strategy.” The Journal of Portfolio Management Real Estate Special Issue 45 (7): 95–112.
Callan Institute. 2019. “2019 Investment Management Fee Study.” https://www.callan.com/uploads/2020/05/0ce3d1da04c2c1d8e13a30a67dbdfabe/callan-2019-im-fee-study.pdf.
Ennis, R.M. 2021a. “Endowment Performance.” The Journal of Investing 30 (3): 6–20.
—— . 2021b. “Failure of the Endowment Model.” The Journal of Portfolio Management 47 (5): 128–143.
French, K. R. 2008. “The Cost of Active Investing.” https://ssrn.com/abstract=1105775 or http://dx.doi.org/10.2139/ssrn.1105775.
Ibbotson, R. G., P. Chen, and K. X. Zhu. 2010. “The ABCs of Hedge Funds: Alphas, Betas, and Costs.” Financial Analysts Journal 67 (1).
Phalippou, L., and O. Gottschalg. 2009. “The Performance of Private Equity Funds.” The Review of Financial Studies 22 (4): 1747–1776.
Sharpe, W. F. 1988. “Determining a Fund’s Effective Asset Mix.” Investment Management Review 2 (6): 16–29.
——. 1992. “Asset Allocation: Management Style and Performance Measurement.” The Journal of Portfolio Management 18 (2): 7–19.
[1] These large endowments, represented by the National Association of College and University Business Officers (NACUBO) (equal-weighted) composite, have assets of greater than $1 billion.
[2] Excess return is simply the difference between the composite return and that of a passively investable benchmark.
[3] The benchmark comprised 56% of the Russell 3000 Index, 16% of the Morgan Stanley Capital International All Country World Index (MSCI ACWI) ex USA Index, and 28% of the Bloomberg US Aggregate Bond Index.
[4] The asset classes are based on the Bloomberg US Aggregate Bond Index, Vanguard High-Yield Corporate Fund (bonds); Cambridge Associates Real Estate Index; HFRI Fund of Funds Composite Index; MSCI ACWI ex USA Index (unhedged and hedged); Cambridge Associates Private Equity Index; and Cambridge Associates Venture Capital Index.
[5] The NACUBO return figure for fiscal year 2021 was not available at the time of this writing. I use as a proxy for it the average of 60 endowments with assets of greater than $1 billion that had reported publicly at the time of writing.
[6] Sometimes this methodology is referred to as quadratic programming.
[7] The results shown in Exhibit 3 are subject to challenge by virtue of the positive correlation among the independent variables (as indicated in Exhibit 2), a condition known as multicollinearity. A consequence of multicollinearity is that estimated allocations among correlated variables (asset class exposures, in this case) are subject to error, and the more highly correlated they are, the greater the potential for error. This is significant, because the estimated exposures are used in creating the performance benchmark. So, significant errors in estimating key exposures can bias the results of performance analysis based on the benchmark. The greatest concern here is the reasonableness of the estimated exposure to non-US equities, because the 13-year annualized returns there (4.1% for unhedged and 6.1% for hedged) are much lower than for US equity (12.1%), private equity (13.4%), and venture capital (15.9%). Accordingly, underweighting the exposure to non-US equity would tend to bias benchmark returns upwardly and alpha downwardly. In this respect, I note that NACUBO reports the actual allocation to non-US equity for the large endowment composite was approximately 16% for fiscal year 2020. This figure is in line with the estimated exposures of 15% and 18% shown in Exhibit 3, indicating little or no bias in the RBSA exposures, at least not from this source.
[8] There exists no source of publicly available data on individual endowment returns. (NACUBO compiles composite data but does not release any data for individual schools.) I have gotten the data I use from the annual reports of the schools and, to a lesser extent, P&I’s Endowment Tracker compilation. After the 25 or so largest funds, the data begins to get sketchy. By this I mean many schools do not maintain public records that would permit reconstruction of their return history to the fiscal year 2009, the starting point for my work in this paper. Accordingly, the 37 funds reported on here are mostly the largest ones but by no means do they constitute a representative sample in statistical terms.
[9] Cost estimates include management fees and transaction costs for marketable securities. Where applicable, they include management fees, carry, and other costs deducted from distributions to limited partners. The cost estimate does not include the cost of operating the endowment investment office, which I estimate to be in the range of 25 bps–75 bps. Nor are the latter costs netted out of the returns reported by NACUBO, meaning they are lost in the shuffle, so to speak.
[10] Callan (2019) is the source for fixed income and equities. The estimate for fixed income reflects the fact the endowments’ investments there are a combination of cash (at no cost) plus investment-grade and high-yield-type investments, the latter of which can cost up to 3% of asset value annually.
[11] Bollinger and Pagliari (2019). The figure indicated is a blend of cost rates for core equity, value-add and opportunistic investments.
[12] Phalippou and Gottschalg (2009).
[13] Ben-David et al. (2020), French (2008), Ibbotson et al. (2010). The 3% figure is somewhat lower than the average reported in the studies.
[14] This analysis uses only the stock and bond indexes.
[15] Cash runs consistently at 4% of total assets in the NACUBO asset allocation data over the study period.
[16] NACUBO reports that large endowments have a 60% allocation to alternative investments.

