Are Endowment Managers Better Than the Rest?
The lore of institutional investing has it that managers of large university endowments in the United States are better at what they do than at least some other institutional investors. Private educational institutions in the US have long prided themselves on their endowment funds. Harvard University and Yale University have storied endowments going back more than three centuries. The management of these portfolios began to attract particular attention in the early 1990s. It was then that the Harvard endowment, managed by Jack Meyer, and the Yale endowment, managed by David Swensen, began posting extraordinary gains relying on unconventional strategies. Other large endowments were quick to follow suit. Elsewhere I have described what then transpired through the mid-2000s as the Golden Age of Alternative Investments.[1]Between 1994 and 2008, NACUBO’s composite of large (greater than $1 billion) endowments produced an average annual excess return (over passive investment) of 410 bps a year. The extraordinary performance was widely noted and celebrated, including fawning media profiles of prominent CIOs. The Golden Age came to an end about the time of the Global Financial Crisis of 2008, with areas of alternative investment, such as private equity, hedge funds and private market real estate equity, ceasing to provide exceptional returns.[2] Since the GFC, the NACUBO composite has underperformed passive investing by more than 2% a year.[3]
An era may have come to an end on the investment scoreboard, but the notion of a certain exceptionalism on the part of at least a few dozen elite private school investment offices lives on. In this vein, not long ago the pages of this journal carried a debate between Laurence Siegel and I on the subject of endowment management. I argued that the so-called endowment model is a thing of the past. Siegel expressed optimism about endowment managers’ prospects for superior performance going forward. While acknowledging that they had stumbled recently, he expressed confidence that they would regain their edge owing to “structural advantages.” This is how I summarized his assessment at the time:
Siegel makes the case for a kind of exceptionalism on the part of endowed institutions that should enable them to outperform other types of institutional investor. He discusses their freedom to invest without constraint.[4] His argument is that rich universities pay better than some other types of institutional investor and offer collegial work environments, which together enable them to attract highly skilled employees. In this vein, he writes they have “...highly respected chief investment officers that are chosen for their independence and intelligence....” He emphasizes the importance of “skilled investors” more than the particular strategy they might employ in managing money. He notes that university investment offices are typically nestled within elite institutions, many of which have distinguished faculty members (Nobel laureates, even) who can add intellectual firepower to investment management. He says that endowment managers rub elbows with captains of industry and finance by virtue of connections made through the graduate business school and board room. Investment managers from all over the world call on them, regarding them as very special clients. In his earlier article, “Don’t Give Up the Ship: The Future of the Endowment Model” (Siegel 2021), Siegel avers, “Endowment funds have...structural advantages...that should allow them to earn above-market risk-adjusted returns in the long run.” That would make them exceptional to be sure.
Is endowment exceptionalism real? Is it myth? Some of both? Let’s see where logic and facts take us.
COMPARING TWO TYPES OF INSTITUTIONAL INVESTOR
I compare the management of large endowments with that of large public pension funds in the US. I begin by comparing their operating environments and cultures. Next, I identify key similarities between endowments and public pension funds as investing institutions. Then I consider differences in the level of investment expense and degree of risk incurred. Finally, I compare the risk-adjusted performance of the two types of institutional investor in an effort to sort things out.
(1) Contrasting Cultures
Some might agree that large endowments have advantages that are “structural” in nature. To my way of thinking, though, things like recruiting and retention, collegiality, potential for helpful associations and specialness, generally—are more environmental and cultural than structural in nature. That said, it would seem that the endowments do indeed have an edge over public pension funds in this regard. Public funds operate in a goldfish bowl, where investment activities are scrutinized, reported publicly and often politicized. They are subject to governmental restrictions and bureaucracy. Their oversight boards comprise part-time trustees, mostly in the public realm and most of whom are laypersons with respect to investing. Their investment staffs are typically compensated at a lower rate than many investment professionals in the private sector. In several important respects, it does seem that public funds are attempting to compete with one arm tied behind their back. But operating environment and culture are just one factor in money management and may or may not have an impact on the bottom line—namely, risk-adjusted return. We need to look further to form an opinion about the importance of endowments’ apparent environmental and cultural advantages.
(2) Similarities as Financial Institutions
There are several important similarities between endowments and public funds as institutional investors. To begin with, public funds and endowments are tax-exempt investors in the US.
Both are institutional funds that would describe themselves as having an amply-long investment time horizon for equity investing.
Both operate under prudent investor standards that afford great latitude, combined with a high standard of care. Loyalty to beneficiaries of the trust is paramount for both.
Both operate freely in the same highly competitive markets. These include global stock and bond markets as well as private equity, hedge funds, private market real estate and commodities.
Both diversify their investments extensively. Large endowments employ an average of more than 100 actively managed portfolios. For large public funds, the figure is more than 150 active portfolios. Measured in terms of return correlation with broad market indexes, both exhibit extensive diversification. The median R2 of large endowments with stock and bond indexes is approximately 96%. For large public funds, the median figure is approximately 98%.
The similarities of endowment and public pension funds as institutional investors are considerable. There are, however, two important institutional differences. One is the amount they expend on investment management. The other is the degree of risk they assume.
(3) Expense Ratio
I have estimated the typical (average) level of investment cost, or expense ratio, incurred by large endowments and public funds (Ennis, 2022a and 2022b). I put this figure at 2.5% for the endowments and 1.2% for big public funds. The real driver of cost is their use of alternative investments, for which they pay approximately 10 times as much as for traditional investments.[5] Endowments average 60% in alts and public funds about 30%.[6]
A composite of large endowment funds underperformed a passively investable, equivalent-risk benchmark by an estimated 2.2% to 2.5% per year over the 13 years ending June 30, 2021 (post-GFC). Public funds underperformed a similar type of benchmark by 1.2% per year.[7] While I compare institutional performance in more detail, below, it is worth noting in passing that the expense ratios and margins of underperformance for the two types of institutions match up closely, by which I mean that both types, in the aggregate, underperform by the approximate margin of their cost. This conforms with a finance dictum that, to the extent markets are efficient, diversified portfolios will underperform by the margin of cost.
(4) Risk
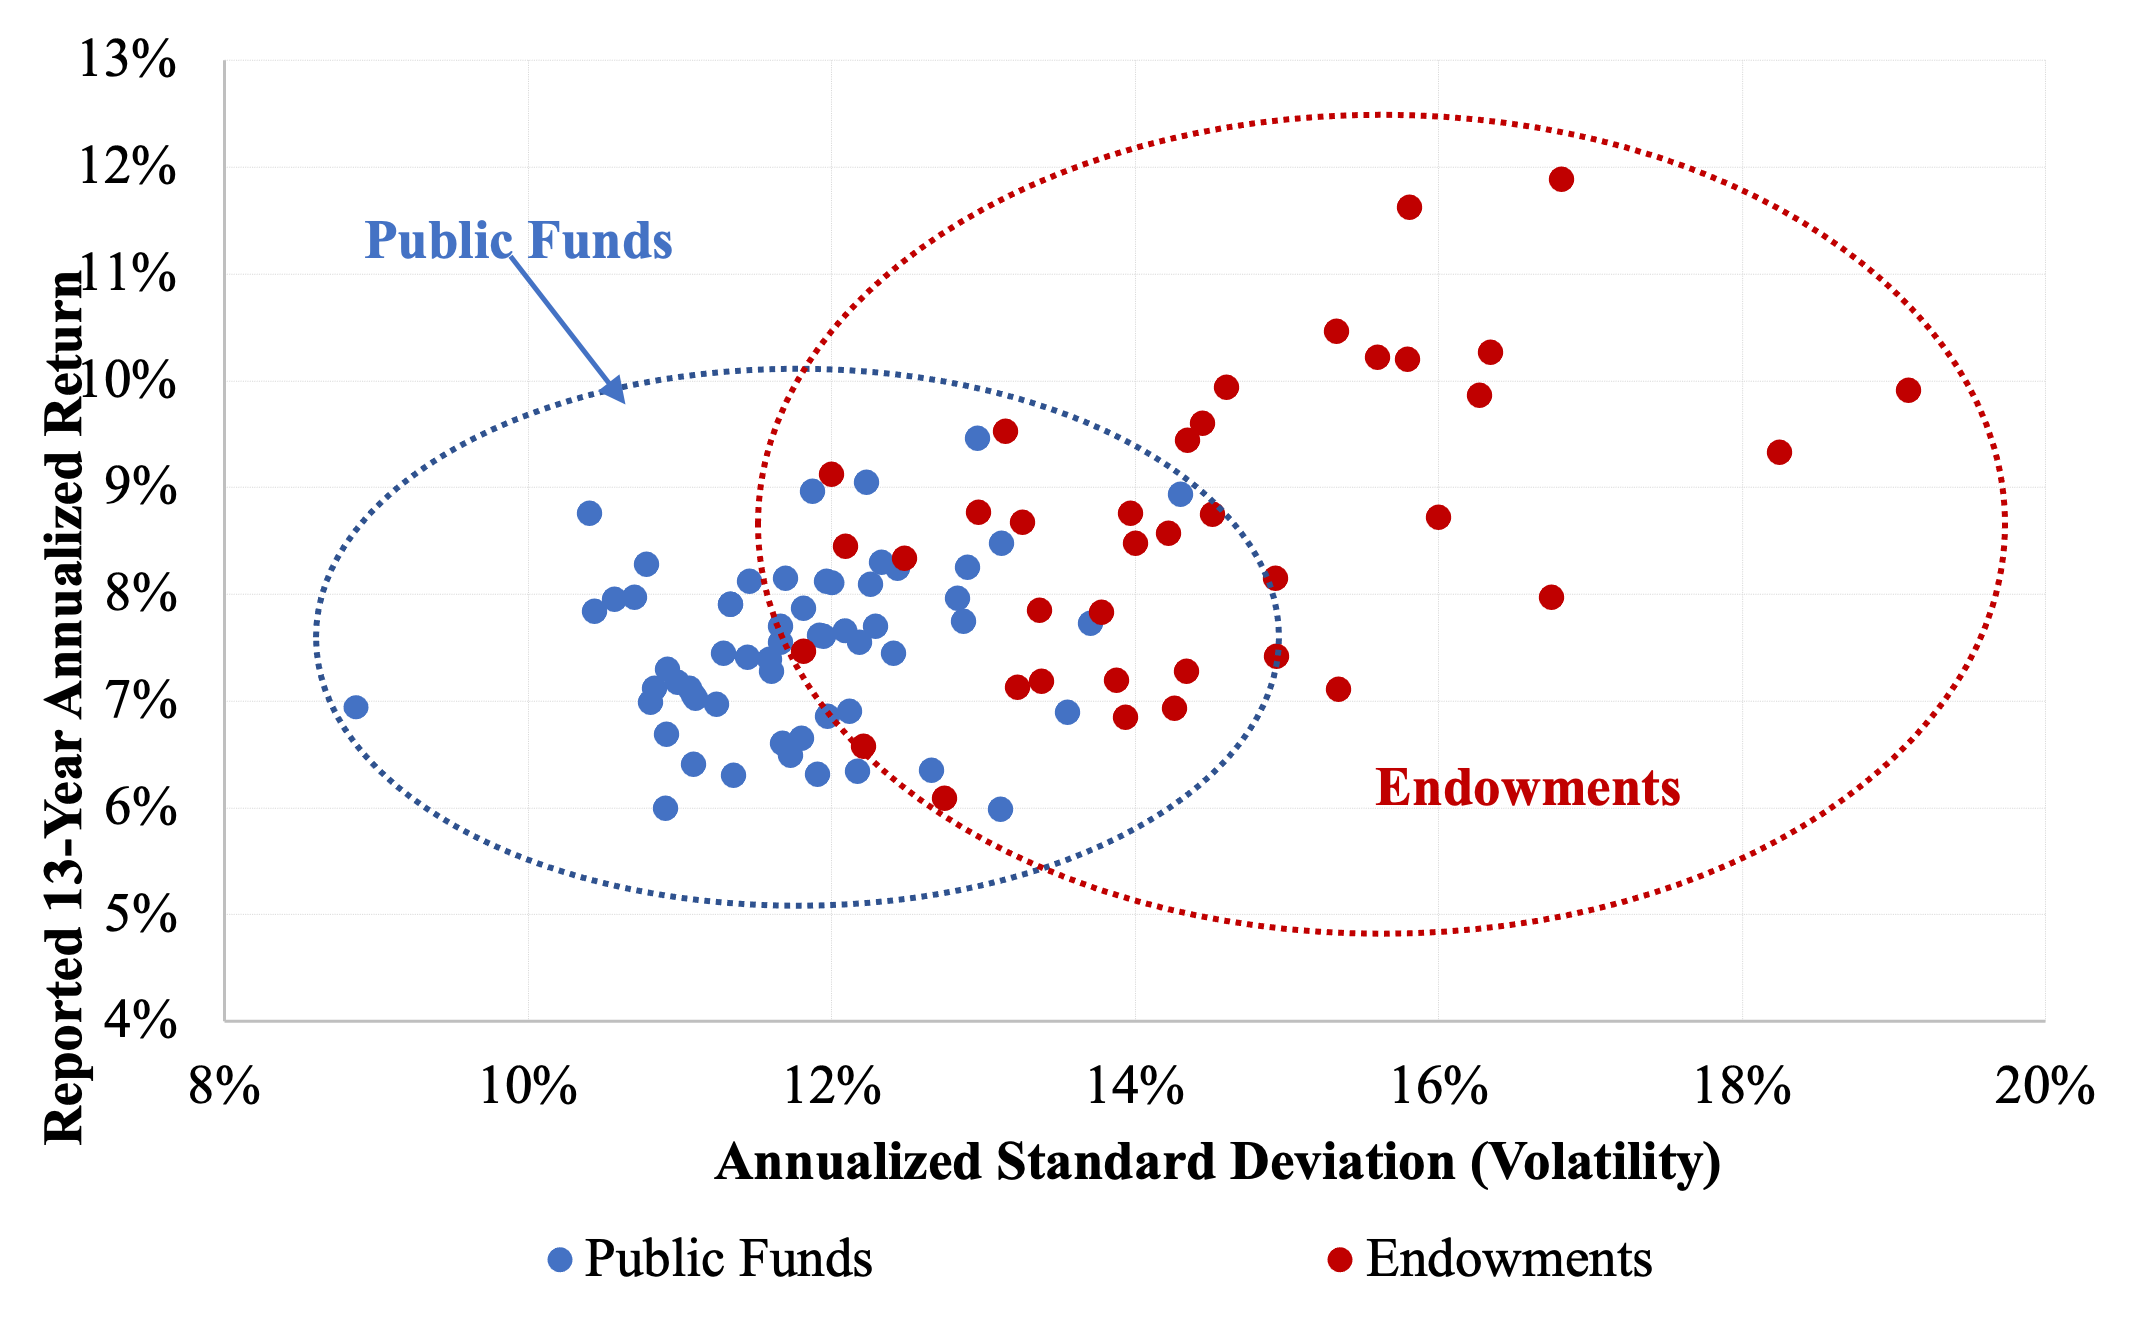
Endowments, as a class, operate at a notably greater level of risk than public funds. Exhibit 1 illustrates return and standard deviation of return for 38 endowments with assets greater than $1 billion and 59 large public funds for the recent 13-year period mentioned above. The endowments (red plot points) operate in a distinctly different—higher risk—habitat than do the public funds (in blue). Endowments operate in a risk habitat demarcated by standard deviation of 12%—20%, while public funds’ more compact habitat encompasses standard deviations of 10%—15%. (The cloud of public fund outcomes exhibits 33% less volatility dispersion than do endowments.[8]) Returns-based style analysis (Sharpe, 1988, 1992) of the return composites of the two investor types produces a similar result, expressed in different terms. Namely, the effective equity exposure of the public fund composite over the period was 71% of assets; endowments had an effective equity exposure of 84%.[9] These results indicate a greater tolerance for risk on the part of the endowments. In the next section I examine the efficacy with which the endowments have employed greater risk.
Exhibit 1
Risk Habitats of Endowments and Public Funds
(13 years ending June 30, 2021)

(5) Performance
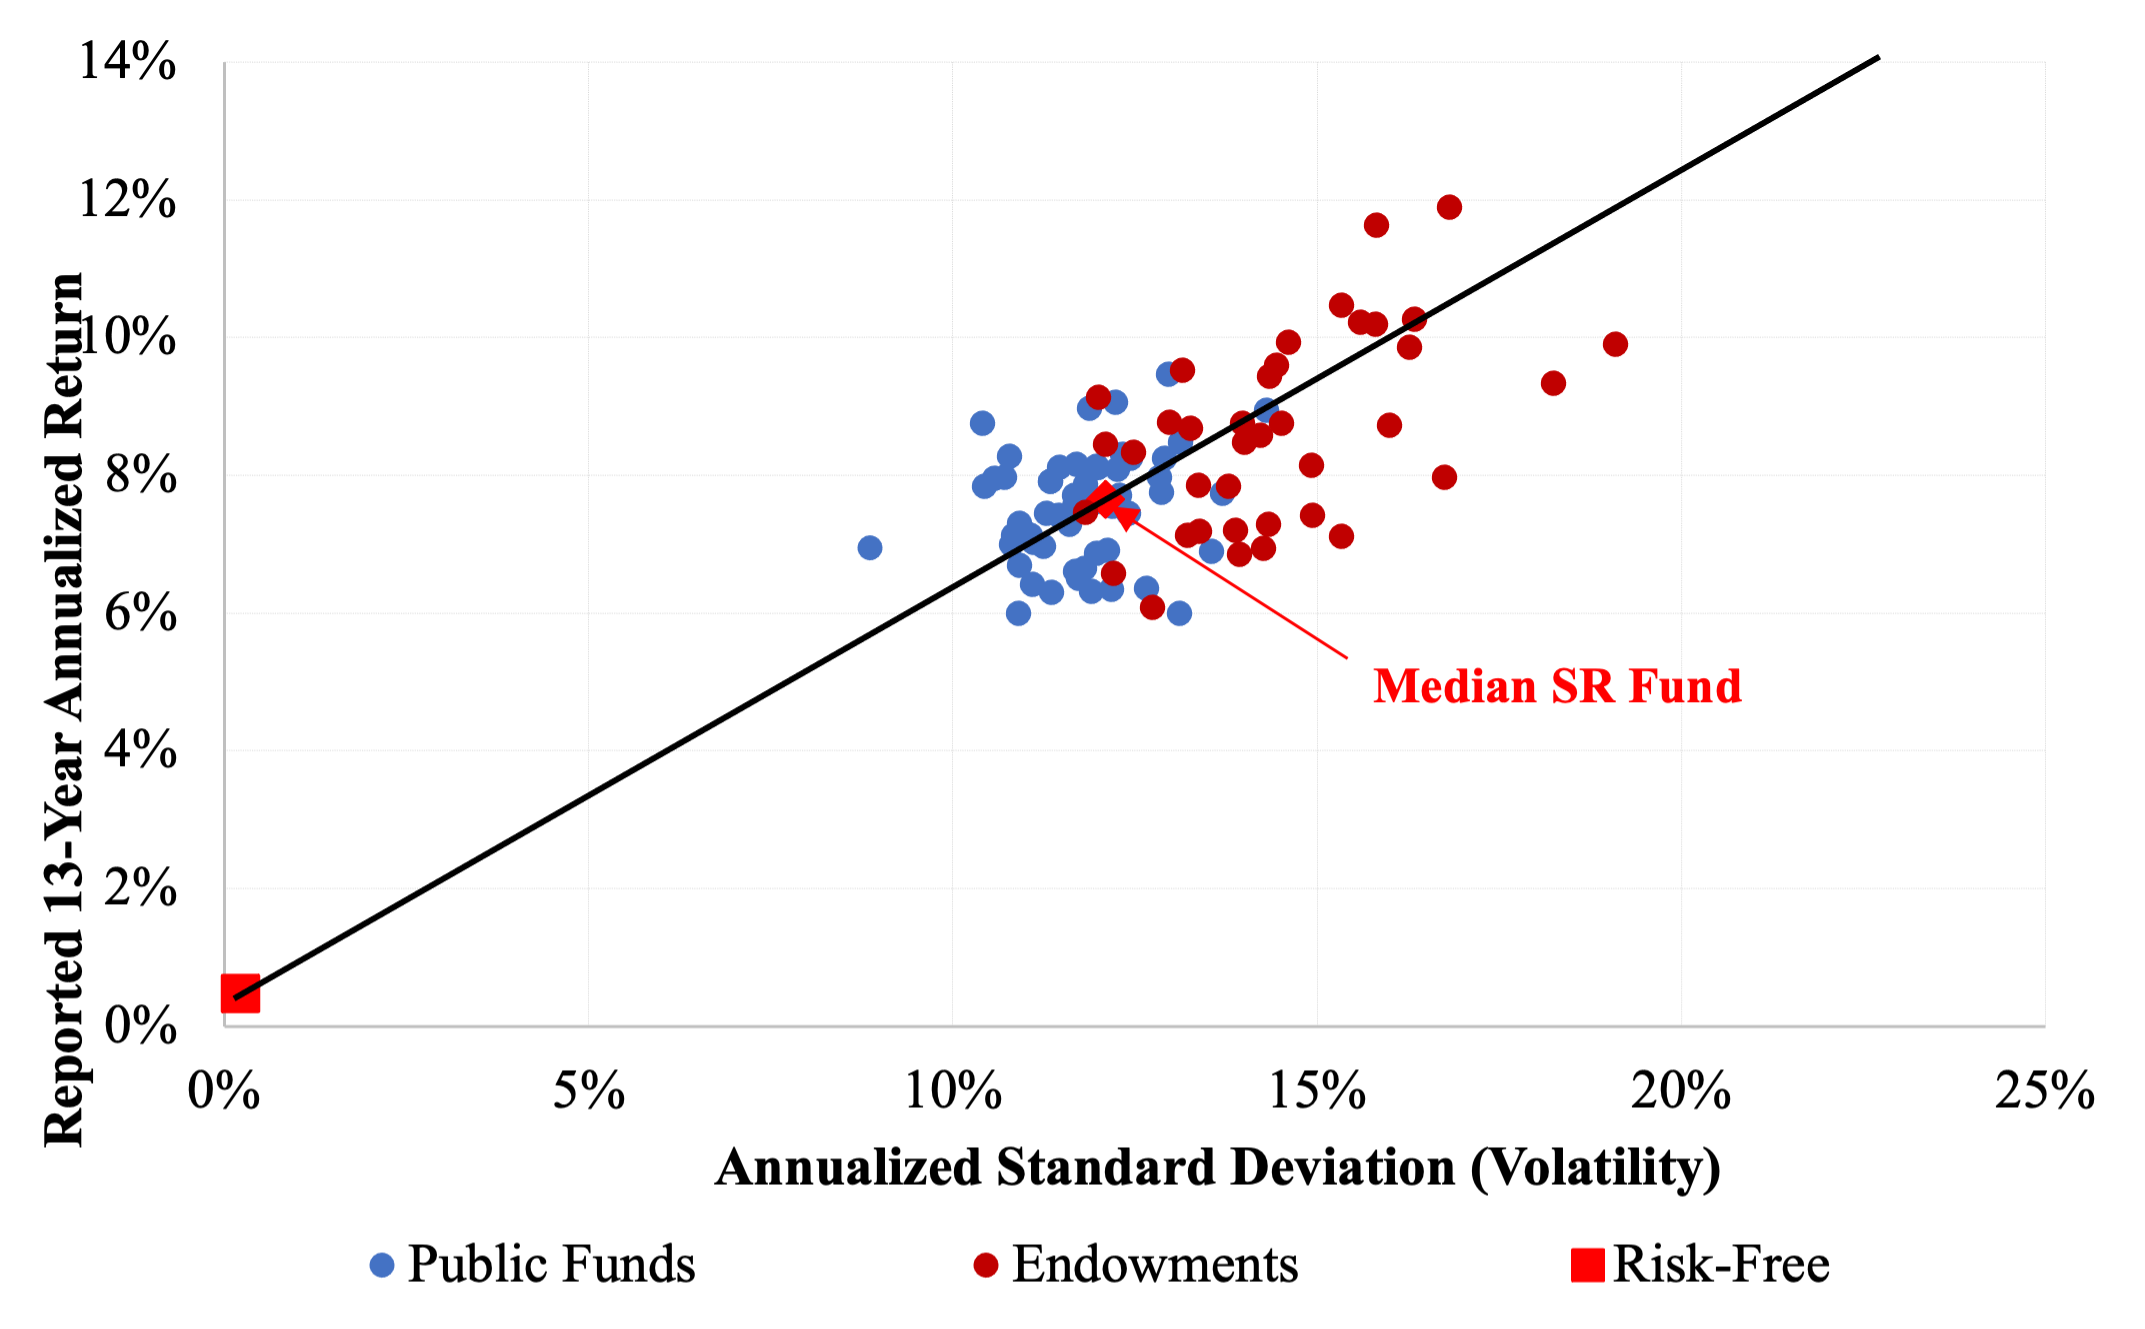
Endowments have generated greater raw rates of return than public funds. The annualized return of the endowment composite described above is 7.90% for the 13-year period cited. The figure for public funds is 7.53%. But the endowments’ risk-adjusted performance is inferior. As previously noted, the endowment composite underperformed passively investable benchmarks by 2.2%—2.5% per year, while public funds underperformed by the lesser margin of 1.2%. (Underperforming by less is better!) Exhibit 2 employs an altogether different metric, Sharpe ratio, to evaluate the performance of the same individual funds shown in Exhibit 1.[10] The line emanating from the riskless asset passes through the portfolio with the median Sharpe ratio among all the portfolios. The line separates funds with favorable risk-adjusted performance from those with inferior results. Thirty-nine percent of the endowments fall above the median-Sharpe-ratio line. Fifty-six percent of the public funds fall above line. Either way we look at it, it is clear that public funds, as a class, have outperformed large endowments since the GFC.
The endowments take greater risk but don’t get paid for it. This, in turn, appears to be the result of the endowments spending more on investment management without benefit (nor even recovering their costs). It certainly does nothing to support the proposition that endowment managers are more skillful than public fund managers in any sense that has implications for the bottom line.
Exhibit 2
Comparison of Risk-Adjusted Performance
(13 years ending June 30, 2021)

CONCLUSION
Based solely on environmental and cultural characteristics, some observers believe large, private university investment offices will outperform other types of institutional investor. They are commonly seen as superior investors, for example, to lumbering, constrained public pension funds. But when we get into the economics of managing highly diversified institutional portfolios in competitive markets, the thesis of endowment exceptionalism quickly loses its resonance. As investing institutions, the two types have many key characteristics that are strikingly similar. Where they differ is cost and risk, both of which are critical aspects of the financial economics of investing. When we correlate all the factors covered here, there is no indication that endowment managers do better than public fund managers. They spend more on asset management and take more risk, but, in the end, come up short.
REFERENCES
Ennis, R.M. 2021a. “Endowment Performance.” The Journal of Investing 30 (3): 6–20.
—— . 2021b. “Failure of the Endowment Model.” The Journal of Portfolio Management 47 (5): 128–143.
——. 2022a. “The Modern Endowment Story: A Ubiquitous Equity Factor.” Journal of Portfolio Management(forthcoming November).
——. 2022b. “Cost, Performance and Benchmark Bias of Public Pension Funds: An Unflattering Portrait.” Journal of Portfolio Management, April. jpm.2022.1.349; DOI: https://doi.org/10.3905/jpm.2022.1.349
NACUBO. 2022. “2021 NACUBO-TIAA Study of Endowment (NTSE) Results.” https://www.nacubo.org/Research/2021/Public-NTSE-Tables
Public Plans Data, Center for Retirement Research, Boston College. (https://publicplansdata.org/quick-facts/)
Sharpe, W. F. 1988. “Determining a Fund’s Effective Asset Mix.” Investment Management Review, September/October 1988, pp. 16-29.
——. 1992. “Asset Allocation: Management Style and Performance Measurement.” The Journal of Portfolio Management 18 (2): 7–19.
[1] See (Ennis 2021a).
[2] See Ennis (2021b).
[3] See Ennis (2022a).
[4] I believe this overstates the potential for unconstrained investing by endowments. Educational institutions are the ultimate investors of conscience. They seemingly move from one moral dilemma to the next in managing their wealth. Divestment mandates have included companies doing business in South Africa, Darfur and Israel. Schools have faced pressure to divest themselves of tobacco, firearms and gambling. They are currently being forced to exclude fossil fuel investments and are retooling investment strategy to embrace ESG considerations more generally. In the mid-2000s, Harvard’s trustees experienced the sustained fury of the editors of The Crimson over the compensation of its highly successful investment staff, which resulted in the departure of key personnel and a reversal of performance. Constraints take various forms in the world of educational endowments. This is unlikely to change in the years ahead.
[5] See Ennis (2022a) for a discussion of costs.
[6] See NACUBO (2021) and Public Plans Data.
[7] See Ennis (2022) for details.
[8] The standard deviations of the individual fund volatilities are 0.9% for public funds and 1.7% for endowments. Dividing these figures by the respective median volatilities (11.7% and 14.3%), the coefficients of variation for the two samples are 7.8% and 11.7%. This indicates that volatility dispersion of public funds is 33% less than it is among the endowments. Explaining the difference in the average level and dispersion is beyond the scope of this paper. It may be a manifestation of greater risk tolerance on the part of the endowments.
[9] Effective equity exposures are derived using returns-based style analysis over the 13 years ending June 30, 2021, using US and non-US equity returns (hedged and unhedged) US investment-grade bond returns as independent variables.
[10] Sharpe ratio return in excess of the riskless return divided by standard deviation of return.

