A Universal Investment Portfolio for Public Pension Funds: Making the Most of Our Herding Ways
Smart institutional investing is as dependent on understanding human nature as it is on projected cash flow, expected return and risk metrics. It requires that we recognize that rationality is bounded, with important implications for sound decision making. It obliges us to resist the temptation to fill the gaps in our understanding with mythology or contrivance. It helps if we can learn to live with what markets can realistically be expected to deliver, and not harbor hopefulness for something more when it’s not in the cards. Smart institutional investing also requires that we acknowledge our strengths and weaknesses. In the case of managing public pension funds, the pay-off for getting it right would be huge.
NEED FOR CHANGE
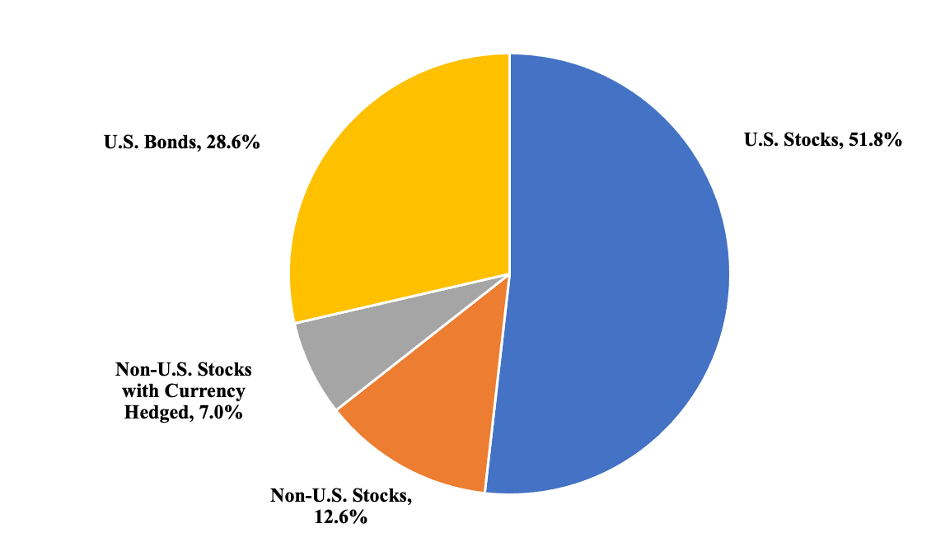
Public pension funds in the United States have underperformed properly constructed benchmarks—ones indicating a fair economic return—by a wide margin and with consistency. I devised such a benchmark for a composite of public pension funds by means of constrained multiple regression analysis (Sharpe 1988, 1992), sometimes referred to as returns-based style analysis (RBSA).[1] The composite includes 59 large public funds.[2] The analysis spans the 13 years ending June 30, 2021,[3] and uses four broad market indexes as independent variables. The resulting benchmark comprises the Russell 3000 Index (51.8%), the Morgan Stanley Capital International All Country World Index (MSCI ACWI) ex USA Index, unhedged (12.6%), that same index, hedged (7%) and the Bloomberg US Aggregate Bond Index (28.6%). See Exhibit 1.
Exhibit 1
Composition of Public Pension Fund Benchmark
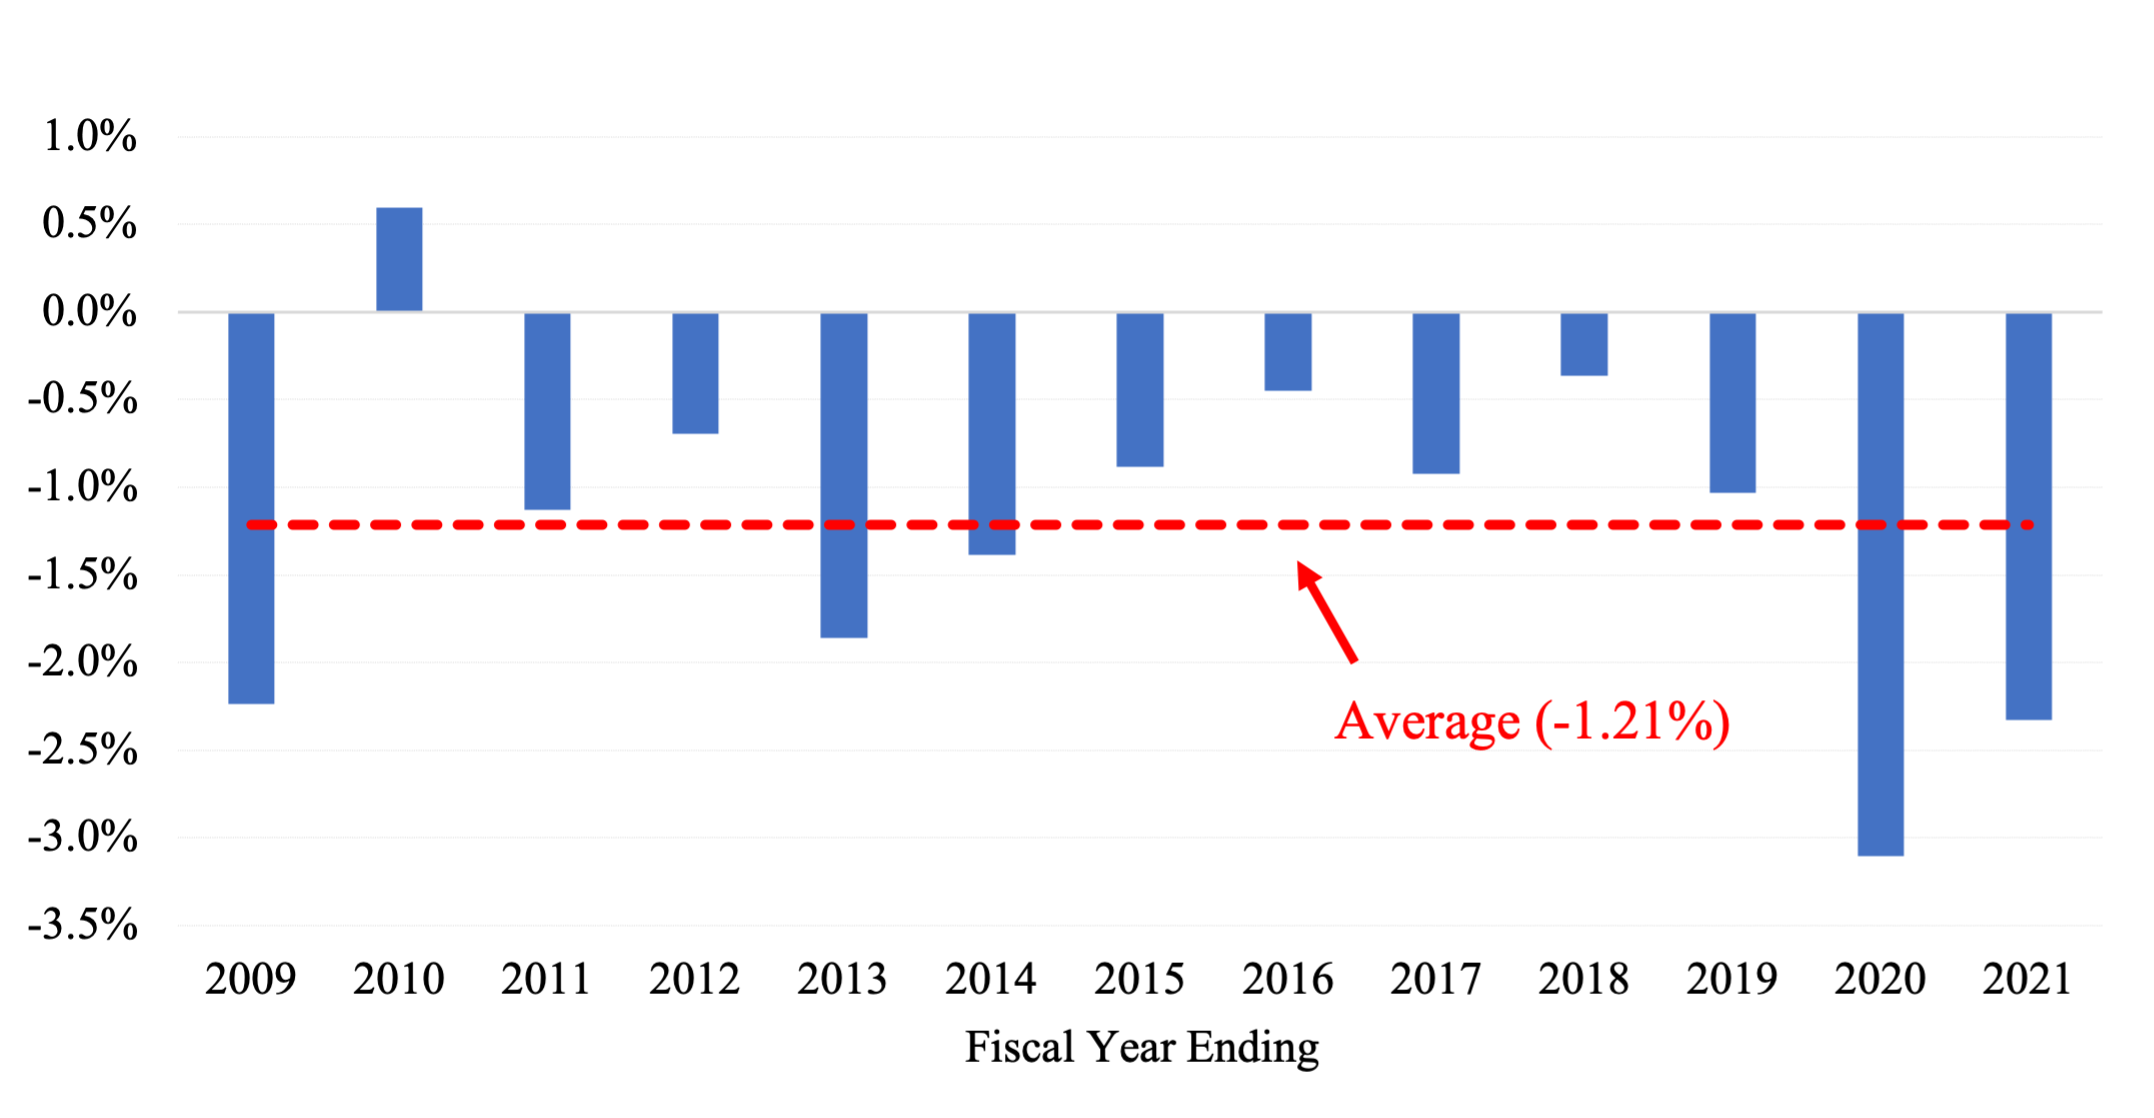
The public fund composite underperformed the benchmark by an average of 1.21% per year over the study period. The margin of underperformance is significant, with a t-statistic of
-3.4. The composite underperformed the benchmark consistently, i.e., in 12 of the 13 years. See Exhibit 2.[4]
Incidentally, I estimate the typical expense ratio of large public pension funds at 1.2%,[5] a figure essentially identical to their collective margin of underperformance.
Exhibit 2
Return in Excess of Passive Benchmark for a Composite of 59 Public Funds
(13 years ending June 30, 2021)
I also examined the cross-section of returns of individual funds. Only one of the 59 individual funds making up the composite had a statistically significant positive alpha; 34 had statistically significant negative ones. The analysis indicates a systemic problem rather than merely a string of bad luck.
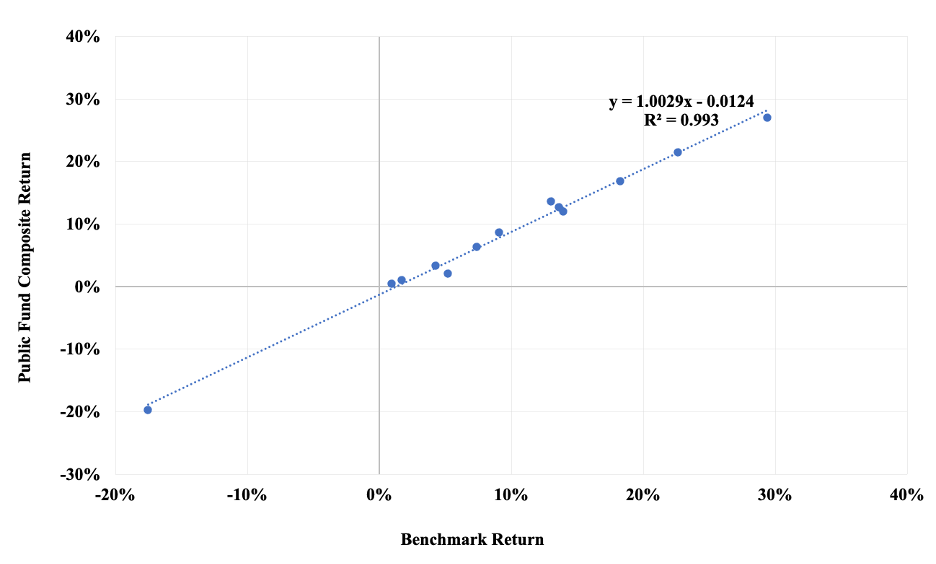
Even though in practice the funds collectively have a 30% allocation to alternative investments, e.g., private equity, private-market real estate and hedge funds,[6] the stock-bond benchmark explains the performance of the composite for all intents and purposes; alternative investments do not have a meaningful impact. See Exhibit 3. The R2and standard error of the benchmark regression equation are 99.3% and 1.02%, respectively. The finding that the correlation between a composite of funds with an average alts exposure of 30% and a marketable securities benchmark is near-perfect runs counter to the popular notion that the return properties of alts differ materially from those of stocks and bonds. That, after all, is an oft-cited reason for incorporating alternative investments in institutional portfolios. But as we see here, alt returns simply blend in with broad market returns in the context of standard portfolio analysis.
Exhibit 3
Regression of Composite Returns on Stock-Bond Benchmark
(13 years ending June 30, 2021)
We can gain insight into how to improve public pension fund performance by examining key elements of their management, and, in particular, their penchant for herding. There are three realms in which herding occurs. First, the great majority of funds operate their investment portfolios with effective equity allocations[7] in the rather narrow range of 67% to 77% of total portfolio value. Second, extensive—extreme, even—diversification is evident across the board. Third, the funds have piled into alternative investments over the past 20 years. The first two forms of herding have proven benign. Not so the third.
EFFECTIVE EQUITY EXPOSURE AND VOLATILITY
Evidence of Herding
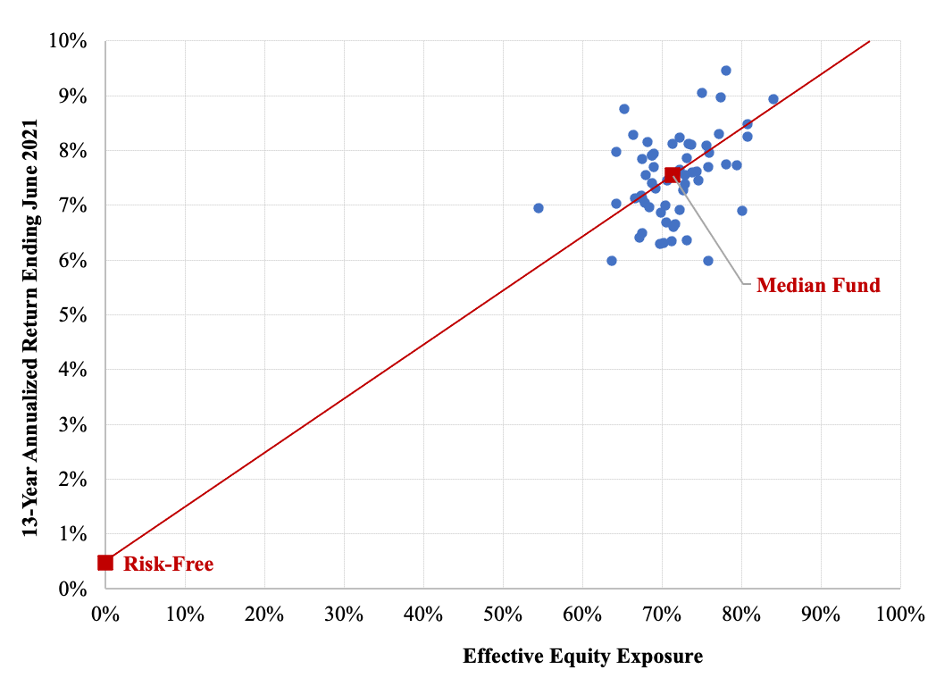
Herding is evident in the effective equity exposure of public pension funds. Exhibit 4 shows the relationship of total return and effective equity allocation, with the funds clustering together noticeably in terms of their effective equity exposure (with North Carolina being an outlier). The median effective equity exposure of the funds (derived by means of RBSA), is 71.5% of total assets. The standard deviation of the effective equity percentages is 5.0%. Accordingly, roughly two-thirds of the funds’ effective equity exposures fall within the rather narrow range of 66.5% to 76.5% in this analysis.
Exhibit 4
Clustering of Effective Equity Exposure
(13 years ending June 30, 2021)
Portfolio volatility is largely a function of equity exposure for diversified portfolios. Exhibit 5 illustrates the effect of asset allocation herding in terms of the clustering of realized standard deviation (volatility) values. The median standard deviation of annualized return of the 59 funds is 11.7%. The standard deviation, or spread, among the volatility values, is a mere 0.9%, just 8% of the median value.
It is noteworthy that, consistent with the earlier discussion of fund performance, virtually none of the funds plotted in Exhibit 5 have risk-adjusted performance better than the Passive Alternative indicated there, which represents the performance of the benchmark illustrated in Exhibit 1.
Exhibit 5
Annualized Return and Standard Deviation of Annualized Return
.png)
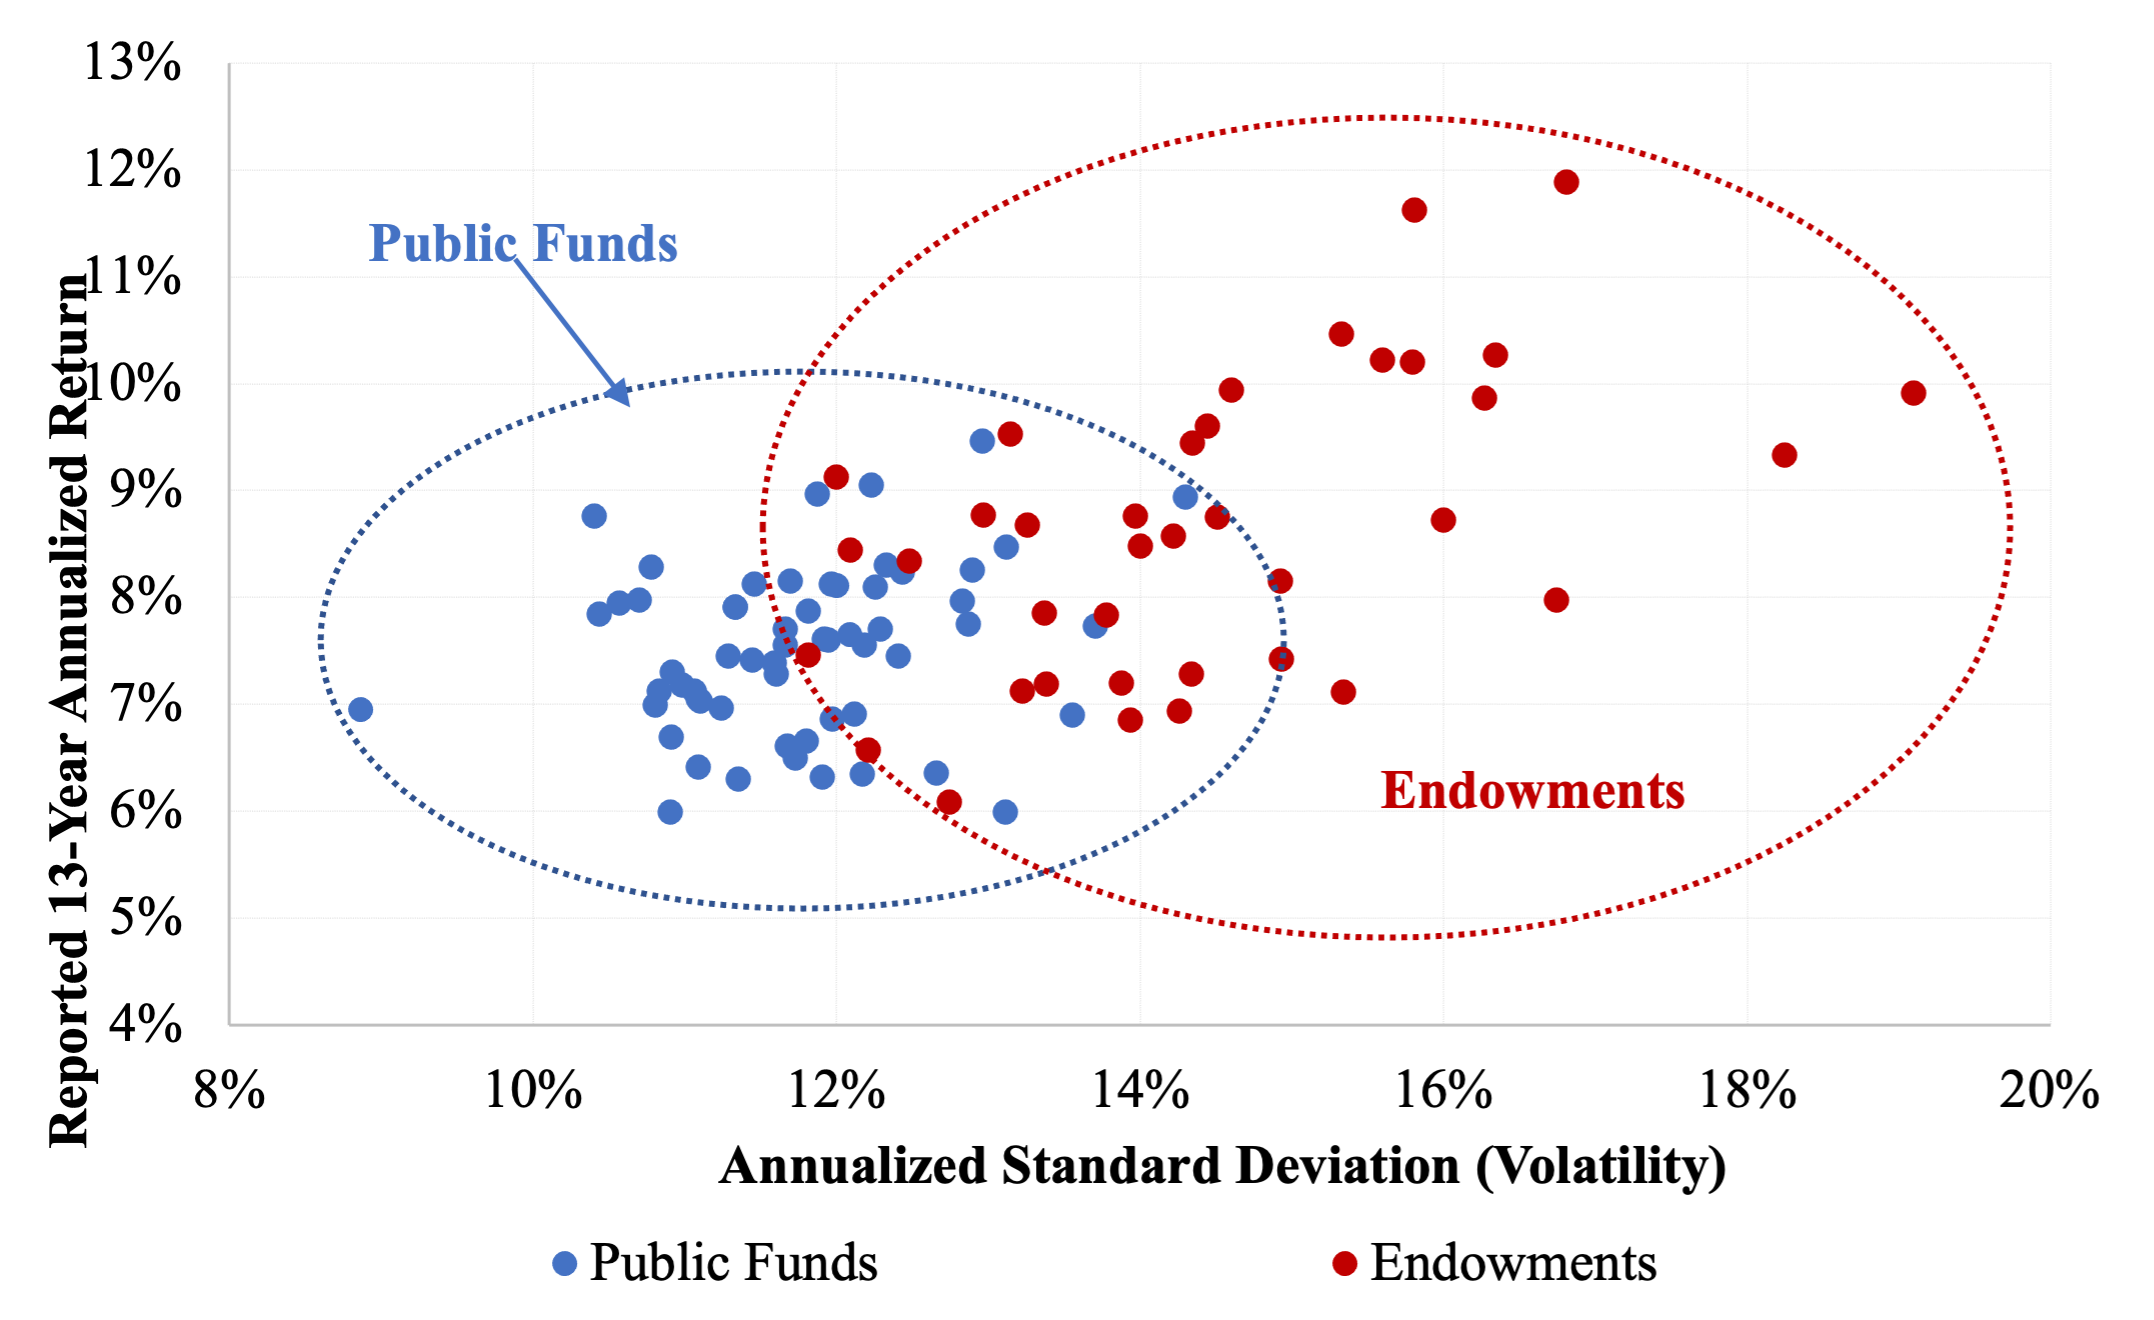
Exhibit 6 contrasts the dispersion of portfolio volatility of public funds with that of large endowment funds. Public fund volatilities fall in the range of 10-14%, for all intents and purposes. Large endowment volatilities fall in the range of 12 to 20%. The cloud of public fund outcomes is much more compact than that of endowments in Exhibit 6; public funds exhibit 44% less volatility dispersion than to do endowments.[8]
The average of endowments’ raw rates of return is greater than that of public funds. The annualized return of the endowment composite described above is 7.90% for the 13-year period cited. The figure for public funds is 7.53%. But the endowments’ risk-adjusted performance is no better. The median Sharpe ratio of the more volatile endowments plotted in Exhibit 6 is 0.57%. The median Sharpe ratio of the public funds is 0.60%. The public funds have generally gotten as much or more return for the risk taken than have the endowments. See Ennis (2022b) for more on this topic.
Exhibit 6
Annualized Return and Standard Deviation of Annualized Return of Public Funds and Endowments
Accounting for Asset Allocation Herding
What explains the asset allocation herding we observe? The simple (and ironic) answer to this important question is: Fund overseers don’t know what else to do. Advancing this rather stark claim is the easy part. There is a lot more to explaining and substantiating it. That task begins with recognizing that herding is innate human behavior.
Human Nature. Herding is a kind of default mechanism in decision making under uncertainty. Being a part of the herd (and preferably near its center) is a risk-reducing instinct for many species. The tendency to herd decreases when people come to believe they have information and/or valid beliefs indicating that there is a better way for them. In other words, people generally want credible justification for striking out on their own when deviating from the beaten path has generally been thought of as risky behavior.
The Legal Standard of Care. The modern standard of care in asset management has its roots in the prudent man rule (Harvard College v Amory, 1830). The legal standard evolved into the prudent investor rule, which is codified in the Uniform Prudent Investor Act (UPIA) of 1992. (The latter takes a total portfolio approach in gauging the prudence of a trustee’s actions,
whereas the prudent man rule focused on the exercise of prudence in connection with individual investments.) The latter embraces the central theme of modern portfolio theory (Markowitz, 1952), namely, that what matters is portfolio risk (as opposed to that of the individual security). Implicit in both versions of the standard is the precept that it is not feasible to codify prudent behavior—to create a list of dos and don’ts. Investing is too complicated, and circumstances and conventions are in constant flux. Accordingly, the standard focuses on the behavior of prudent persons. Thus, it is a practice-based standard. The trustee is expected "to observe how men of prudence, discretion and intelligence manage their own affairs," in the words of Justice Samuel Putnam, writing in the original prudent man rule. In other words, the discharge of prudence cannot be judged in a vacuum; rather it is to be judged with awareness of, and a measure of respect for, how prudent investors conduct themselves. In this respect, fiduciary law, as it has evolved, reinforces human nature to be cautious and cognizant of the practices of prudent others.
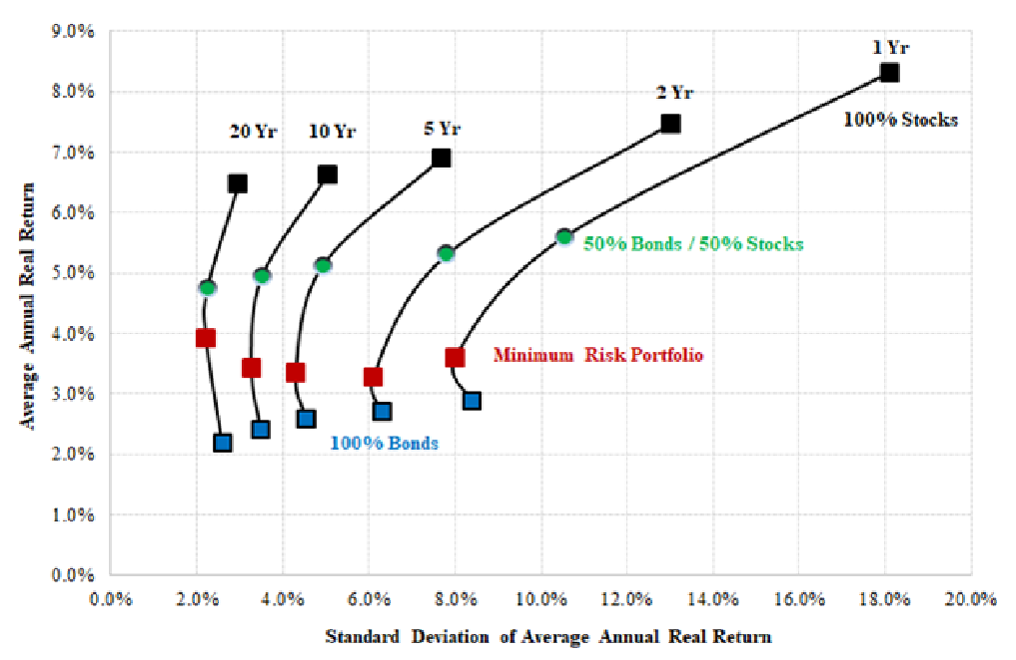
Stock-Bond Diversification. “Seventy-thirty” (or “60-40” or “50-50,” for that matter) is no passing fancy. The quintessential form of diversification for long-term investors is to own a goodly slug of bonds along with one’s equities, because the two areas of investment are generically different. Common stocks provide the expectation of growth with uncertainty. Bonds provide a lesser expected return with relative stability. (Bills provide the least return over the long run but with year-to-year certainty.) These are integral features of securities that derive from the design of the instruments and manifest themselves in the resulting cash flow patterns, making stocks, bonds and bills the quintessential asset classes. By virtue of these fundamental differences, stocks and bonds exhibit a consistent pattern of relative volatility over time: bonds regularly exhibit a fraction of the volatility of stocks. Furthermore, the average correlation of stocks with bonds in the U.S. has averaged a mere 0.17 during the 44 years ended December 31, 2019, with a maximum of 0.64 and a minimum of -0.47. For these reasons, stocks and bonds have proven to be reliable building blocks in bringing about the diversification effect shown in Exhibit 7, resulting in a frontier consistently convex in the direction of the vertical axis. The power of stock-bond diversification has proven itself to be one of the few verities of investing. Moreover, in terms of investment analysis, the result is elementary; no great genius or advanced quant skill is required to apprehend it. And it derives from observable asset-pricing in the marketplace, not a theory or model.
Exhibit 7
Stocks and Bonds, the Natural Diversifiers
(Periods ending December 31, 2019)
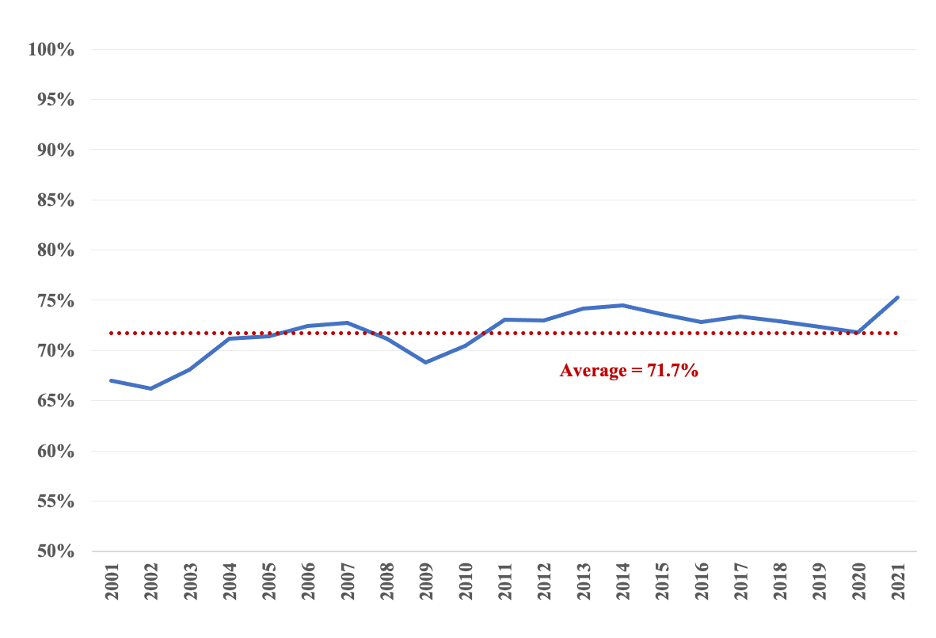
Clustering at ~70%. Equity allocations of public funds were statutorily limited to 40% or less of portfolio value in most jurisdictions until the 1980s. As legal restrictions began to give way to the prudent investor standard (which does not limit the percentage invested in various types of investments), funds began to gradually increase their effective equity allocations to increase expected return. The average allocation to equities among public pension funds was approximately 23% in 1982. It rose to 50% by1992.[9] The aggregate effective equity allocation continued to rise steadily and leveled off in the range of 67% to 75% at the turn of the century. The average value has been 71.7% over the last 20 years, as illustrated in Exhibit 8.[10] This is evidence that, in terms of risk, “70-30” has proven itself tenable as an institutional norm of equity exposure among this class of investors—a pragmatic expression of group risk tolerance.
Exhibit 8
Effective Equity Exposure of Public Pension Funds over Time
I believe we are on solid ground at this juncture in describing how effective equity exposures have evolved over time and come to cluster about a norm of roughly 70%. The clustering is born of human nature and has been reinforced by fiduciary law. Implicit in the norm is the enduring merit of combining stocks and bonds for efficient diversification, with no additional investment insight or technology required. The value of approximately 70% was arrived at by means of cautious habituation over time. The result constitutes a real-world, experientially-derived, collective asset allocation choice—the product of a decades-long natural experiment.
Efforts to Refine Investment Policy Beyond “70-30.” Pension plan managers have sought to advance beyond the simple 70-30 formulation by means of various constructs and analytical methodologies. Asset-liability analysis is one example of this. This typically involves making projections of pension liabilities and state funding, combined with asset simulations, to identify an optimal portfolio in a liability-aware context. But public DB pension plans in the US use unrealistically high discount rates in valuing liabilities, which dramatically understates the liabilities relative to their economic value; and their discount rates do not fluctuate with marketplace interest rates. This artificial treatment of liability valuation is incompatible with accepted asset-liability-matching methodologies, in which liabilities as well as assets are valued at market. It is difficult to imagine how an optimal economic solution (investment policy) might come of such an approach. In any event—and this is the point—I find no evidence of a relationship between funded ratio and investment risk borne among public funds, as might be the case if investing were somehow predicated on liability value.[11] Furthermore, public funds do not make meaningful allocations to long-dated bonds as a matter of investment policy; nor is there evidence of long-bond allocations in their reported returns.[12] Thus, public funds look more like asset-allocators than liability-matchers.
Many plan managers simplify the asset-liability connection by just adopting the actuary’s earnings assumption as the rate of return objective for the investment portfolio. This practice is devoid of financial logic. The actuary’s earnings assumption is simply a number that equates assumed gains from investing plus assumed contributions from the state—both of which are purely speculative—with projected cash outflows, i.e., uncertain future benefit payments. In other words, the earnings assumption is a precise number that conveniently balances the books, fuzzy as they might be, without regard to anyone’s risk tolerance. The following facts underscore the irrelevance of meeting the actuarial earnings assumption in ensuring successful pension plan funding: Public pension plans have earned an estimated 8.8% rate of return on assets over the past 30 years. This figure is well in excess of actuarial earnings assumption rates ranging from 7% to 8% over the same period.[13] This indicates that persistent unfunded pension plans across the US (currently about 75% funded, down from 102% in 2001) are the result of past funding choices of the states, not pension funds failing to achieve actuarial earnings assumptions.
Most fund managers use capital market models and portfolio optimization techniques to identify superior multi-asset-class investment strategies, including for alternative investments. This activity invariably winds up justifying complex asset allocation plans and lots of investment managers. But there is no evidence that these efforts have had an influence on effective asset allocation or have improved risk-adjusted performance. Exhibit 3 provides evidence in support of these conclusions.[14] In sum, for all its complexity and cost, multi-asset-class management contributes little or nothing to portfolio diversification; moreover, it has detracted from performance relative to purely passive management.
Earlier I teased that effective equity allocations cluster about 70% because fund overseers don’t know what else to do. By this I mean that their efforts to improve upon “Passive 70-30” by means of various investment policy planning devices have really come to naught. And so, stock-bond allocations have come to rest in the neighborhood of “70-30.”
DIVERSIFICATION: MORE HERDING
Public fund trustees and their staffs have a preference for extensive—extreme, even—diversification. This is not surprising. Most fund trustees are lay persons operating in a public, often politically-charged, environment. And nothing is more central to the discharge of fiduciary duty than is diversification. State statutes typically require plan trustees to diversify the investments of the system so as to minimize the risk of loss unless, under the circumstances, it is clearly not prudent to do so (paraphrasing typical statutory language). Nevertheless, it is both interesting and instructive to see the lengths public fund trustees and their staffs go to to achieve, what is to them, satisfactory diversification. The Center for Retirement Research at Boston College reports that large public funds employ an average of 182 portfolios, virtually all of which are actively managed. One can only conjecture at the number of active investment positions (bets) that are represented by this number of managed portfolios—upward of 3,000 would be my guess.[15] This is a highly inefficient approach to diversification.
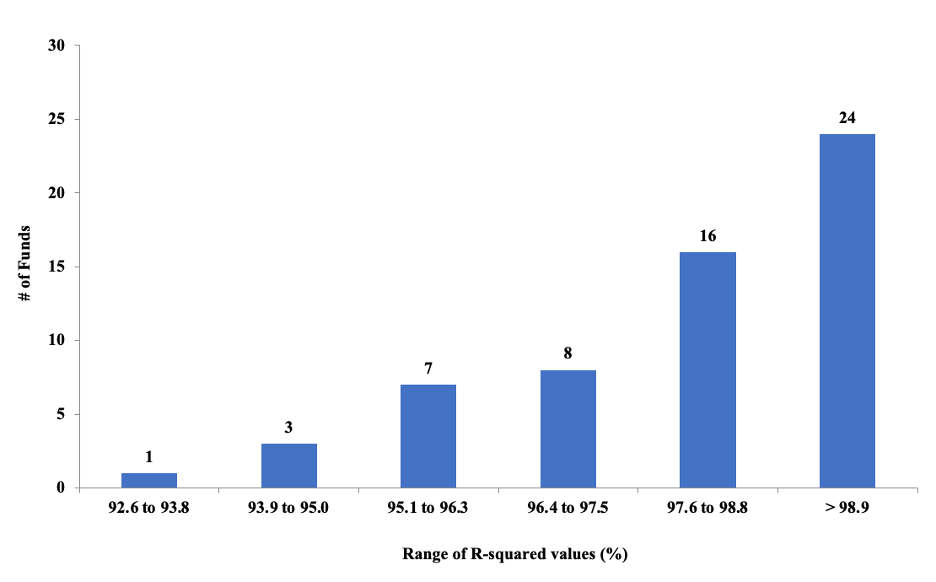
The extreme diversification is evident from statistical analysis of the funds’ returns. In this regard, I regressed the returns of the 59 funds against the returns of indexes for US and non-US stocks and investment-grade bonds. Exhibit 9 shows the distribution of their market R2s. Just one fund has an R2 less than 93.8%. Twenty-four (41%) of the funds have R2s ranging from 98.8% to 99.7%. Public fund trustees across the board exhibit a pronounced aversion to non-market (active) risk; they are most comfortable with a market R2 of 98% to 99+%.
Exhibit 9
Distribution of Observed R2s of Individual Funds
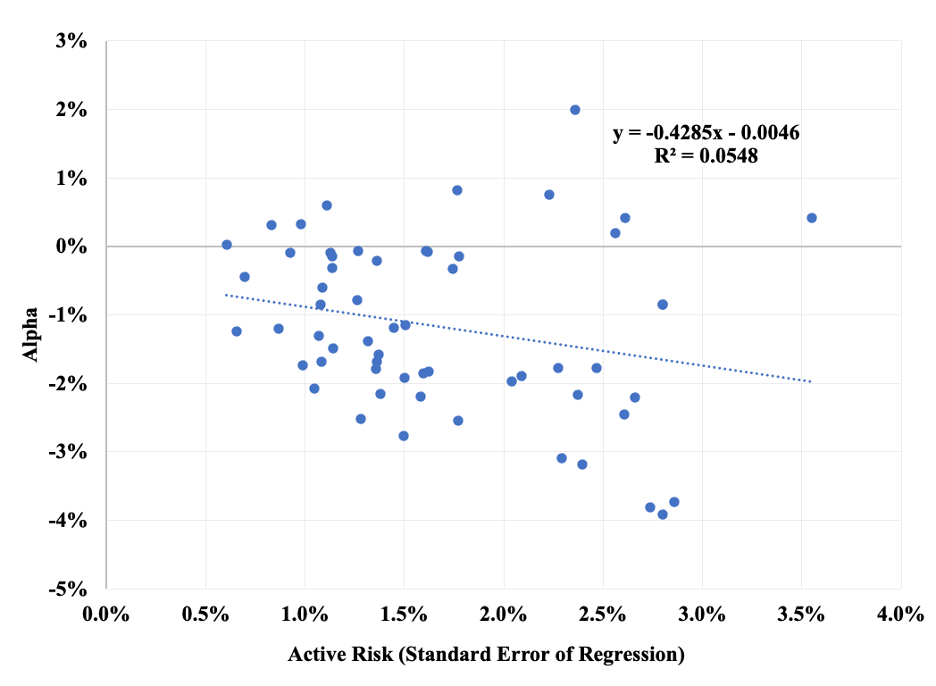
Trustees’ aversion to active investment risk hasn’t hurt them. By this I mean they haven’t experienced an opportunity cost from tightly controlling it. This is evident in Exhibit 10, which shows the relationship of fund alpha to active risk. Although the slope coefficient is just shy of statistical significance (t-statistic of -1.8), the relationship between alpha and active risk is negative. Herding is evident in the funds’ diversification practices, just as it is in their manifest comfort with “70-30.” Both constitute benign forms of herding, something that we do not observe in the funds’ seeming infatuation with alternative investments.
Exhibit 10
Relationship Between Alpha and Active Risk
(13 years ending June 30, 2021)
ALTERNATIVE INVESTMENTS
Large public pension funds have piled into largely illiquid alternative investments, such as private equity, private real estate and hedge funds, in recent decades. The average allocation to “alts,” as they are often referred to, increased from less than 10% in 2001 to more than 30% at June 30, 2021.[16] The motivation for this major asset allocation shift was that alts were thought to provide a diversification benefit plus an alpha owing to market inefficiency and the accessibility of skillful managers. I have shown (Exhibit 3, from Ennis, 2021a) that alts generally haven’t contributed to public fund diversification, at least not since the Global Financial Crisis of 2008 (GFC). Exhibit 11 indicates that, at the same time, alternative investments, in general, ceased to be a source of positive alpha.[17]
Exhibit 11
Excess Annual Return for Three Types of Alternative Investments, Before and After the GFC
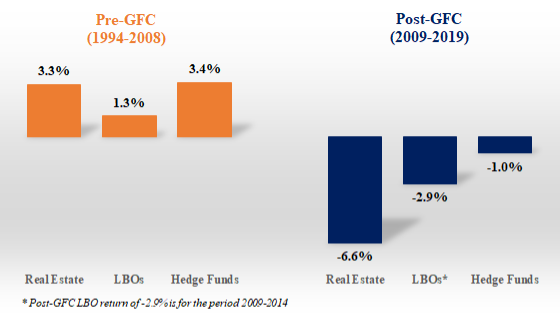
Source: Ennis (2021a)
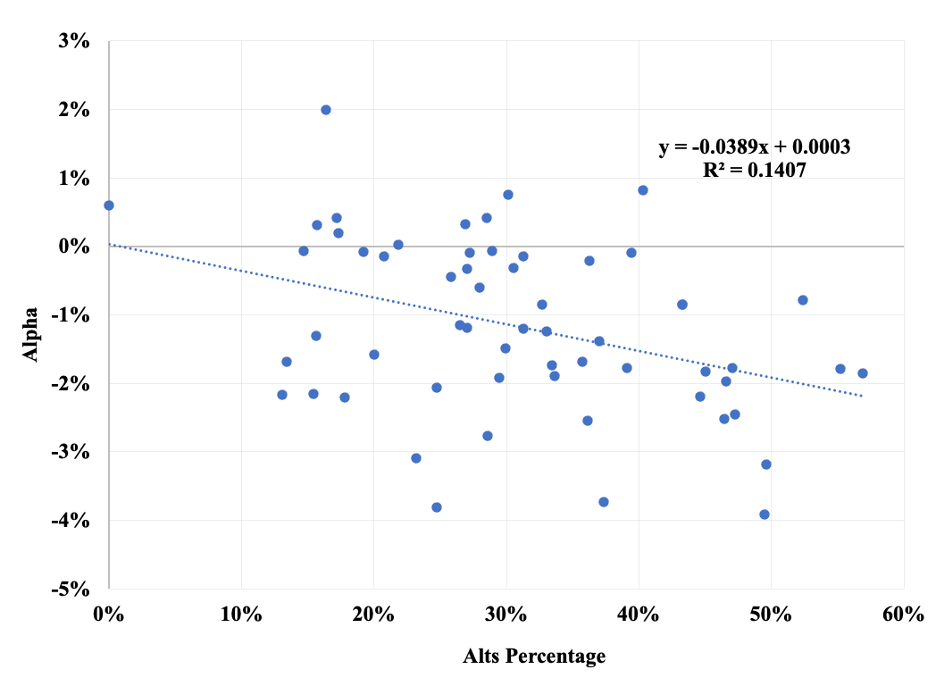
Exhibit 12 indicates that alternative investing has hurt the performance of public pension funds. It illustrates the relationship between the alpha earned by the 59 funds described above and their exposure to alternative investments for the 13 years ending June 30, 2021. The slope coefficient is -0.039, with a significant t-statistic of -3.1. The negative slope indicates that a reduction in alpha of nearly 80 basis points per year relative to marketable securities alone is associated with a 20% allocation to alts, and 120 bps for a 30% allocation. An interpretation of the latter result is that the underperformance of alts alone has been sufficient to account for the overall underperformance (at -1.21% per year) of public funds.
Exhibit 12
Relationship Between Alpha and Allocation to Alternative Investments
(13 years ending June 30, 2021)
Two things explain the evolution of alternative investing. One is that their markets have become much more efficient than, say, in the 1990s,[18] with returns generated there having become highly correlated with US stock market returns.[19] The other is their cost, which I estimate at 3-4% for a typically diversified portfolio of private equity, real estate and hedge funds.[20] The combination of greater market efficiency and high cost has rendered diversifiedalternative investing a losing proposition. And public funds have indeed diversified their alternative investments. Of the typical 182 managed portfolios I referred to above for large public funds, 144 represent alternative investment partnerships. It is easier to explain why alts have been a major drag on public fund performance than it is to explain why the funds have persisted in pouring money into the area so long after the party there appears to have ended. I surmise that it is a form of groupthink (herding), albeit an unfortunate one.
In their enthusiasm for alternative investments, and active management more generally, the funds have their eye on the wrong ball. They are trying to earn a positive alpha—to beat the market. They attempt to do this while incurring a typical expense ratio of 120 bps and maintaining a typical market R2 of 98%—99% (i.e., investing with negligible active risk). This is the fatal flaw of public pension fund management. Extreme diversification is just fine and comes naturally in the context of public pension fund management. But investment expense has to be commensurate with the prospect of an incremental active return. Based on the funds’ manifest preference of near-market-like diversification—and, thus, negligible active risk—their expense ratios should be next to nothing. Moving their alternative investment moneys into index funds would be a way to make their investing more cogent. Moving to a fully passive form of implementation would, in my judgment, optimize it.
THE UNIVERSAL INVESTMENT PORTFOLIO
I propose that an enterprising investment management organization (manager) create and market what I refer to as the Universal Investment Portfolio (UIP) for Public Pension Funds. The UIP would be designed to mimic the future return of public pension funds in the aggregate, before costs. [21] The UIP would operate as a purely passive portfolio, with an expense ratio that declines as assets under management grow. After costs, it would reliably perform well up in the top quartile of funds owing to its low cost. There are approximately $6 trillion in public pension fund assets in the US. When the UIP fund reached one trillion in assets under management, a fee of one basis point would produce $100 million in revenue. I believe a manager with existing deep passive management capabilities could turn a tidy profit on a fee like that for managing a single portfolio.[22]
For their part, public funds need to come to terms with their nature. Given the large size of their portfolios, the limitations imposed by their operating environment and penchant for diversification, they should embrace their singular comparative advantage. It’s not active money management, that’s for sure. Rather, it is their potential to—collectively—become the lowest-cost producer of investment returns on the planet. That is where public pension funds should ultimately congregate.
CONCLUSION
Herding is human nature. There is ample evidence of it in the management of public pension funds in the United States. Their effective equity exposures cluster about an average of approximately 70%. Extreme diversification is universal. These two aspects of herd behavior have proven benign. Where herding has had a detrimental effect is the funds pouring more than a trillion dollars into alternative investments after alts ceased adding value to institutional portfolios more than a decade ago. One might say two out of three ain’t bad. And yet, the heavy use of active management, and alts, in particular, has cost the funds dearly. Public fund managers need to understand that their strength is not active money management. Rather, it is their potential to become the lowest-cost producers of institutional investment returns anywhere. This article proposes a super economical, one-size-fits-all approach to managing public pension investments—namely, embracing a Universal Investment Portfolio.
ACKNOWLEDGMENTS
I am indebted to the following for their helpful contributions: Anonymous, Elroy Dimson, Barry Gillman, Robert Maynard, Paul O’Brien, Michael Sebastian and William Sharpe.
REFERENCES
Ennis, R.M. 2020. “Institutional Investment Strategy and Manager Choice: A Critique.” Journal of Portfolio Management (Fund Manager Selection Issue): 104-117.
——. 2021. “Failure of the Endowment Model.” The Journal of Portfolio Management 47 (5): 128–143.
——. 2022a. “Cost, Performance and Benchmark Bias of Public Pension Funds: An Unflattering Portrait.” Journal of Portfolio Management, April, 48 (5) 138-150.
——. 2022b. “Are Endowment Managers Better than the Rest?” Journal of Investing (forthcoming). Available at https://richardmennis.com/blog.
——. 2022c. “The Modern Endowment Story: A Ubiquitous Equity Factor.” Journal of Portfolio Management(forthcoming November). Available at https://richardmennis.com/blog.
L’Her, Jean-Francois, Rossita Stoyanova, Kathryn Shaw, William Scott and Charissa Lai. 2016. “A Bottom-Up Approach to the Risk-Adjusted Performance of the Buyout Fund Market.” Financial Analysts Journal, Volume 72, Issue 4 (July/August), pp. 36-48.
Markowitz, H.M. 1952. “Portfolio Selection.” Journal of Finance, 7, 77-91.
The Pew Trusts. 2014. “State Public Pension Investments Shift Over Past 30 Years.” https://www.pewtrusts.org/~/media/assets/2014/06/state_public_pension_investments_shift_over_past_30_years.pdf.
Public Plans Data, Center for Retirement Research, Boston College. https://publicplansdata.org/.
Sharpe, W. F. 1988. “Determining a Fund’s Effective Asset Mix.” Investment Management Review, September/October 1988, pp. 16-29.
——. 1992. “Asset Allocation: Management Style and Performance Measurement.” The Journal of Portfolio Management 18 (2): 7–19.
Sullivan, Rodney N. 2021. “Hedge Fund Alpha: Cycle or Sunset?” Journal of Alternative Investing, Winter, 23 (3) 55-79.
[1] RBSA is also known as quadratic programming when constraints are imposed in the course of the regression. The constraints prohibit short selling and leverage, and require all the regression coefficients to sum to 1.0.
[2] Return data are from Public Plans Data, Center for Retirement Research, Boston College.
[3] Some elaboration on the choice of the 13-year (June 2008 to June 2021) study period is warranted. First, it is longish by the standards of public fund performance reporting. By this I mean the longest time period typically employed in public fund reporting is 10 years. Second, it represents a market cycle—from the peak prior to the Global Financial Crisis of 2008, through the collapse, and then a through a sustained and major bull market.
[4] The performance results are robust to time period. Annualized excess returns over the last 5- and 10-years periods are -0.83% and -1.0%.
[5] See Ennis (2022a) for particulars of the cost estimate.
[6] See Public Plans Data.
[7] I use the terms “effective equity allocation” and “effective equity exposure” throughout this paper in recognition of the fact that reported equity allocations are ambiguous and potentially misleading. Hedge funds, for example, are typically not classified as equity but have an equity beta of about 0.5. Likewise, private market real estate is not typically classified as equity but has an equity-like beta. Venture capital has an equity beta 1.5 or more. I use RBSA to estimate all effective allocations/exposures.
[8] The standard deviations of the volatilities are 0.9% for public funds and 2.0% for endowments. Dividing these figures by the respective median volatilities (11.7% and 14.7%), the coefficients of variation for the two samples are 7.7% and 13.7%. This indicates that volatility dispersion of public funds is 44% less than it is among the endowments.
[9] See Pew Trusts, 2014.
[10] Source: Public Plans Data.
[11] I regressed the funded ratio of 56 public funds on their standard deviations of annualized return over the past 20 years and found the correlation of funded status and investment risk (measured as standard deviation) to be zero.
[12] I included the 30-year Treasury bond in the RBSA discussed previously to evaluate the influence of long-duration bonds on the the returns of public funds. The long-bond loading was zero in this analysis.
[13] See Public Plans Data.
[14] I discuss this in depth in Ennis (2021a).
[15] Assume there are an average of 175 actively-managed portfolios of various types per pension fund, each portfolio with an average of 20 holdings. That is a total of 3,500 active positions.
[16] See Public Plans Data.
[17] For real estate, I subtract the returns of the FTSE NAREIT All-Equity REIT Index from those of the Cambridge Associates Real Estate Index, using quarterly IRRs to estimate TWRs for the Cambridge series. For buyout funds these are the average excess returns reported by L’Her et al. (2016) in Tables 3 and 4 for size-, leverage- and sector-adjusted returns. The hedge fund excess returns are as reported by Sullivan (2021).
[18] See Ennis (2020) for a discussion of structural developments in alternative investment markets contributing to efficiency.
[19]See Ennis (2022c) regarding market correlations.
[20] See Ennis (2022a) for a discussion of the cost of alternative investments in support of the 3%–4% figure. In practice, alternative investments are about 10 times more costly than traditional ones.
[21] The allocation indicated in Exhibit 1, derived by means of RBSA, illustrates the effective static asset allocation of the 59-fund composite for the 13-year period of the study. The technique known as dynamic RBSA might be better suited to estimating the aggregate asset allocation of public funds in the future, at least for next year. (See https://caia.org/sites/default/files/alphaperformance_websiteupload_7-5-18.pdf, p. 23.) Nevertheless, I would not simply assume that a RBSA solution is the best estimate of the going-forward allocation. I would want to supplement any RBSA analysis with current asset allocation data as reported by sources such as Public Plans Data, CEM Benchmarking, Greenwich Associates, custodial banks, consultants and databases such as eVestment.
[22] Pension plan trustees that would prefer a slightly lower-risk portfolio could place 5% or 10% of their assets in Treasury bills. Those seeking a slightly greater risk level could introduce a modicum of leverage. In this way, participating plans could establish risk exposures that span the range indicated in Exhibits 4 and 5 without a meaningful loss of cost effectiveness.

