The Fairy Tale of Alternative Investing
A fairy tale has sustained alternative investing since the Global Financial Crisis (GFC) of 2008. It goes like this:
Alternative investments, such as private equity, hedge funds and private-market real estate, are largely uncorrelated, low-beta strategies. They are volatility dampeners and have been a reliable source of alpha. Owing to their defensive character, alternatives, or alts, simply have not been able to keep up in the bull market that began in 2009, during which large-cap U.S. stocks, like those driving the S&P 500 Index, have been on a tear. Despite alts having been a drag on institutional investment performance in recent years, their day will come again. In fact, it may come sooner rather than later, with stocks at near-record-high price-to-earnings ratios (P/Es) and bond yields at extremely low levels. Surely, this is not the time to be a stock-and-bond-only investor.
A foreboding ignored: Educational endowments, which are big alts investors, of course, had a warning shot across their bow when they felt the effects of the GFC. The National Association of College and University Business Officers’ (NACUBO) composite of large endowments, with an average allocation to alts then of 42% of assets, half of which was hedge funds, registered a loss of 20.5% in their fiscal year ended June 30, 2009. In comparison, an equivalent-risk benchmark comprising 72% stocks and 28% bonds lost only 18.1% in that year. Harvard University, Princeton University, and Yale University, all with much larger alternative investment allocations, recorded an average loss of 25.1% then. The larger drawdown by the alts-heavy endowments came as a surprise to many of them. Undeterred, they pushed their alternative investment allocations higher yet, to an average of 60%, comforted in part by the fairy tale.[1] Over the 12 years ended FY 2020, that same composite of endowments underperformed the same stock–bond benchmark by about 150 bps a year (and in 10 years out of 12), largely as a result of the poor showing of alternative investments.[2]
I parse the fairy tale, starting with supposed volatility-dampening engendered by alternative investments.
VOLATILITY
Exhibit 1 reports CEM Benchmarking’s (CEM) estimate of the volatility experienced by large institutions’ investments in five asset classes. These are the volatilities of actual investments by asset class of large institutions monitored by CEM.[3] It is apparent that the low-volatility characterization of alts is a myth. Bonds are a much better choice for volatility dampening. Even hedge funds, which are thought by some to be great volatility dampeners, are twice as volatile as bonds.
Exhibit 1
Volatility Experienced by Investors
(1998–2018)
|
Asset Class |
Volatility |
|
Private Equity |
25.8% |
|
Real Estate |
18.0 |
|
Large-Cap Stocks |
17.5 |
|
Hedge Funds |
11.4 |
|
Bonds |
5.2 |
Source: Beath and Flynn (2018).
CORRELATION
Exhibit 2 presents correlation coefficients for a number of asset classes (based on annual returns, with no attempt at “unsmoothing” them). The average correlation coefficient of the alt classes with the Russell 3000 is .93—quite high, in other words. Alternatives are far from being “uncorrelated” assets. Ironically, they are not alternative enough.
Investors in search of a diversifying asset have a powerful one right under their noses—namely, bonds. The correlation of bonds with U.S equities is –0.34.
Exhibit 2
Alts’ Correlation with U.S. Equities
12 Years Ended June 30, 2020
|
Alternative Asset Category |
Correlation Coefficient |
|
Buyouts |
.98 |
|
Real Estate |
.88 |
|
Hedge Funds |
.94 |
|
Average |
.93 |
Sources: Cambridge Associates, HFR
AS DIVERSIFIERS
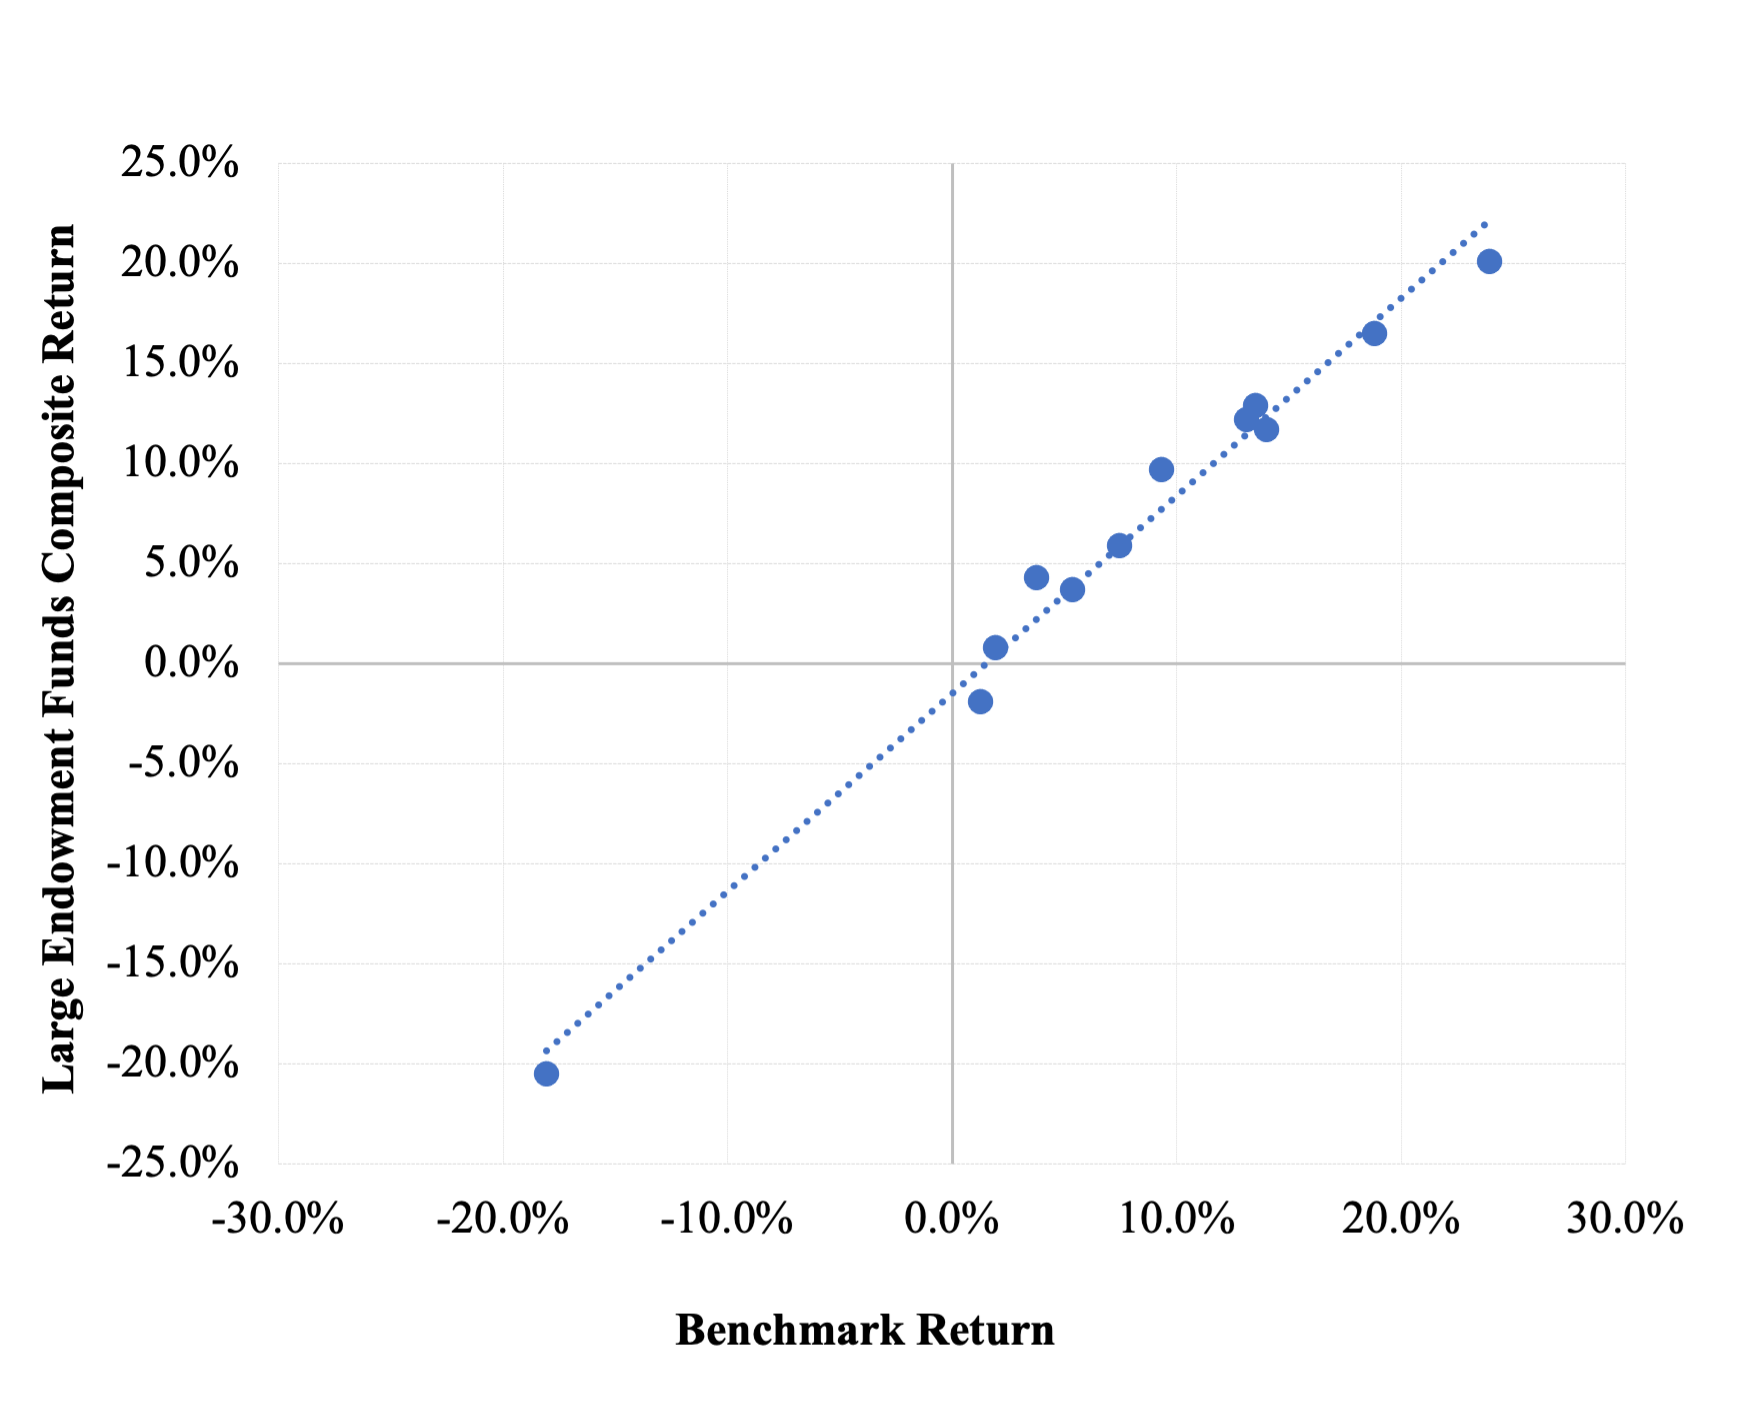
As a result of their high correlation with stocks, alts have ceased to provide diversification benefits (if they ever did so). All but a tiny fraction of NACUBO’s large fund composite’s return variance can be explained using three broad stock and bond indexes. The indexes (and their multiple regression weights) are the Russell 3000 (60%), MSCI ACWI ex-US (13%), and Bloomberg Aggregate U.S. (27%). Exhibit 3 illustrates regression of the returns of NACUBO’s composite on a benchmark consisting of those indexes at their weights for the 12 years ended June 30, 2020. The slope (beta) is 0.99, the R2 is 0.984, and the standard error of the regression is a minimal 1.4%. The intercept, or alpha, is –1.88% (t-statistic of –3.6). The snug-fitting scatter plot demonstrates that stock and bond indexes alone capture the return-variability characteristics of alternative investments in the endowment composite for all intents and purposes; alternative investments do not have a meaningful impact. This finding runs directly counter to the notion that the return properties of alts differmaterially from those of stocks and bonds. That, after all, is an oft-cited reason for incorporating alternative investments in institutional portfolios. But as we see here, alt returns simply blend in with broad market returns in the context of standard portfolio analysis.
Exhibit 3
Regression of NACUBO Large Endowment Composite on the 73%-Global-Stock, 27%-Bond Benchmark (12 years ended June 30, 2020)
PERFORMANCE
Some say that, owing to their being low-beta strategies, alts should not be expected to keep up with stocks in sharply rising markets. Exhibit 4 provides performance statistics for three principal classes of alternative investments during the bull market that began in 2009. The statistics result from a multiple regression of those alts’ returns on ones of blended benchmarks of relevant equity and fixed-income indexes.[4] Effective equity exposure is the sum of the regression weights of various equity indexes. The R2s average 82%. These results indicate that the alts moved with the equities in the bull market according to their degree of systematic risk. At the same time, all three alt categories had negative alphas, averaging –3.3%. The main culprit in the alts’ underperformance was their average annual cost of 3%–4% of asset value for a diverse portfolio of them.[5] Defenders of alts using the low-beta argument are discounting alts’ betas, which are alive and kicking, while overlooking their very ample negative alphas as the source of their lagging returns.
Exhibit 4
Performance Statistics for Private Equity, Hedge Funds,
and Real Estate During the Bull Market Beginning in 2009
|
|
Private Equity |
Hedge Funds |
Real Estate |
|
Effective Equity Exposure |
100% |
43% |
100% |
|
Alpha |
-0.9% |
-3.1% |
-6.0% |
|
R2 |
81% |
89% |
77% |
Sources: Asset class returns are from CEM Benchmarking
(Beath and Flynn 2018), HFR, and Cambridge Associates.
EXPECTED RETURN
Some alt advocates cite prevailing high P/Es and low bond yields as a reason to emphasize alts in the current market environment. They claim that alts are the better play in times like these. Let’s say public market values are inflated and due for a correction. Why, one must ask, should we believe that alternative assets—which behave much like efficiently-priced traditional assets nowadays, but are much more costly—would provide a superior risk-adjusted return going forward? Try as I might, I can not come up with logic to explain such a viewpoint. Nor, in light of the GFC bear market experience cited above, is there historical precedent for alts being the better bet when stocks are in for a sell-off. Deep into a bull market, though, we encounter this canard regularly. A golden apple figures prominently in fairy tale literature; here we have the golden alpha of the fairy tale of alternative investing.
Research into the nature of expected return, such as that of Ilmanen et al., 2020, is helpful here. Exhibit 5 provides their estimate of the trend in expected return for public and private equities (U.S buyouts) over 25 years. Net, real expected return, as depicted there, is based on a number of factors, including the prevailing earnings yield of buyout deals, the extent of leverage, cost of debt, and expenses incurred. According to the authors, the “downtrend in [private equity expected return] from the 1990s to the 2010s, [is] driven by richening [private equity] multiples...and a gradual decline in leverage.” The main cause of the variability in expected return over time is fluctuation in the borrowing rate in connection with leverage employed. Exhibit 5 reveals the passing of a once-in-a-lifetime opportunity that existed in private equity in the early 1990s. That opportunity resulted from an abundance of dirt-cheap deals for US buyout funds and a little-developed (inefficient) and tiny market for investing there. It also shows how those valuations came into line with pricing in public markets as funds poured in and markets became more efficient and better integrated with public ones.
Exhibit 5
Net-of-Fee Expected Returns for Private Equity and Public Equity
(January 1, 1993–September 30, 2018)
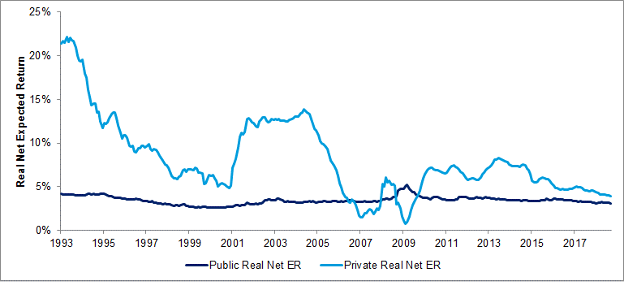
Source: Ilmanen et al. (2020).
Exhibit 6 provides similar insights from the same authors (Ilmanen et al. 2019) regarding real estate investments. It illustrates how private market real estate–capitalization rates move (with a lag) with those of publicly traded REITs. As public market cap rates declined from a high of about 10% in 2000 to about 6% in 2018, private market cap rates fell from about 8.5% to about 4.5%. Both diagrams show that the expected returns of the private market assets track expected returns in the public markets that envelope them and dwarf them.
This brief review of evidence concerning expected returns is inconsistent with the argument that stretched public market valuations bode well for private market returns.
Exhibit 6
The Valuation Gap between Private and Public Real Estate
(January 1, 1994–June 30, 2018)
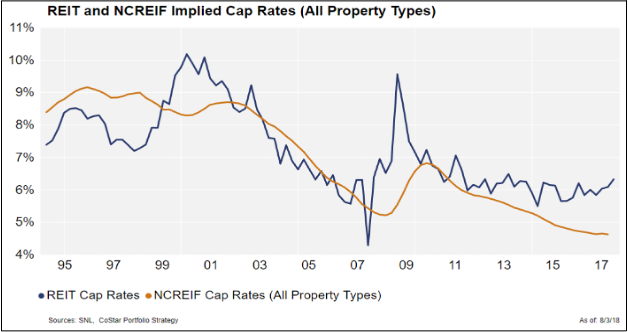
Source: Ilmanen et al. (2019).
CONCLUSION
The fairy tale narrated in the introduction of this article is just that—a fairy tale. Some allocators are too well informed and disciplined to buy into it. Many, though, cling to the fairy tale ardently in justifying heavy commitments to alternative investments. (Public pension funds have about 30% in alts. The figure for large endowments is about 60%. That’s a lot of alts.) But this is not the early-1990s, when the heyday of alternative investing was getting underway. Nor is it 2008, when the alts party wound down. Now, 14 years later, we have a much better understanding of the nature of alternative investments, including their steady and significant underperformance since the GFC. How much longer are institutional investors going to take a beating from overdoing alternative investments?
REFERENCES
Beath, A. D., and C. Flynn. 2018. “Real Estate Performance by Investment Implementation Style.” CEM Benchmarking Inc. https://www.cembenchmarking.com/research/Real_estate_by_implementation_style.pdf.
Ennis, R.M. 2021. “Endowment Performance.” Journal of Investing, 30 (3) 6-20.
_______ . 2022. “Cost, Performance and Benchmark Bias of Public Pension Funds: An Unflattering Portrait.” Journal of Portfolio Management, forthcoming. Available at https://papers.ssrn.com/sol3/papers.cfm?abstract_id=3883370.
Ilmanen, A., S. Chandra, and N. McQuinn. 2019. “Demystifying Illiquid Assets: Expected Returns for Private Real Estate.” https://www.aqr.com/Insights/Research/White-Papers/Demystifying-Illiquid-Assets-Expected-Returns-for-Private-Real-Estate.
Ilmanen, A., S. Chandra, and N. McQuinn. 2020. “Demystifying Illiquid Assets: Expected Returns for Private Equity.” The Journal of Alternative Investments 22 (3): 8–22.
[1] Average alternatives allocation of large endowments at June 30, 2020, according to NACUBO’s public NACUBO -TIAA Study of Endowments (NTSE) tables. https://www.nacubo.org/Research/2020/Public-NTSE-Tables.
[2] Ennis (2021).
[3] To estimate the return volatility experienced by individual institutional investors in private equity and other asset classes, CEM adds both: (i) the average variance in annual returns (i.e., the variance in alpha or idiosyncratic risk squared) and (ii) the variance in the average annual return (i.e., the variance in beta, or standard deviation of average returns squared). For an investor who could index an investment, the idiosyncratic risk (i) is close to zero and the volatility is close to the standard deviation (ii) of the average return. For private equity where the idiosyncratic risk (i) is large, the volatility experienced by an investor is substantially larger than standard deviation of annual average returns (ii). The effect of calculating volatility is to restore a measure of idiosyncratic risk at the individual investor level that disappears when the average fund return is used in calculating standard deviation. Volatility is analogous to standard deviation for analytical purposes.
[4] Real estate returns (from Cambridge Associates) and hedge fund returns (from HFR) are for the 12 years ended June 30, 2020. Private equity returns (from Beath and Flynn 2018) are for the 10 years ended December 31, 2018. All three series begin with the bull market that began in 2009.
[5] See Ennis (2022) for a discussion of the cost of alternative investments in support of the 3%–4% figure.

