Second-Guessing CalSTRS on Investment Strategy: A Case Study
“CalSTRS to Weigh New Opportunistic Sleeve,
Eliminates 55% Limit on Private Assets”
So goes the headline of a recent article in Pensions & Investments, the industry newspaper for institutional investors. The article describes a proposed new allocation of up to 5% of fund assets. P&I reports, “The new portfolio would give CalSTRS flexibility ‘to identify, research and incubate new and compelling strategies’ that may fall beyond existing asset classes because of their structure, their benchmark or their thematic focus.” [1]
California State Teachers Retirement System (CalSTRS), with $319 billion in assets at June 30 of 2023, has long been an investor in alternative asset types. Its allocation to alternatives rose from about 10% of assets in 2001 to about 44% in 2023. The recent alts figure compares to an average of 34% for large public pension funds in the US. Upon reading the P&I article, I decided to explore the merit of CalSTRS’s proposed strategic shift, which is likely to place even greater emphasis on controversial alternative asset types.[2]
PUBLISHED STUDIES
I am aware of three studies that examine whether alternative investments have been a source of added value for funds like CalSTRS. There have, of course, been many studies seeking to evaluate alternative investment performance. What is distinctive about the studies summarized below is that they deal with alts’ performance in the context of diversified multi-asset class portfolios.
Andonov (2022), an academic paper, uses institutional return histories provided by CEM Benchmarking. The author evaluates returns over the period 1991-2017. He examines the performance of five alternative asset classes: real estate, private equity, hedge funds, commodities and infrastructure. Andonov concludes, “I find that institutional investors significantly underperform their passive public equity benchmarks by investing in alternative assets. Thus, a significant fraction of the expected returns and diversification benefits in alternative assets seems to be captured by intermediaries through fees.”
Beath and Flynn (2022) also use CEM institutional fund return data. Whereas Andonov compared the returns of alts to equity benchmarks, Beath and Flynn calculated Sharpe ratios for various asset classes to judge their performance alongside other assets, public and private. In that work, they calculated the Sharpe ratio of various asset classes used by US defined benefit pension funds for the period 1998–2020.[3] See Exhibit 1. Bonds’ exceptional Sharpe ratio (0.66) reflects the extraordinary, secular downtrend in interest rates over the period, combined with the low return volatility inherent in bonds. The Sharpe ratio of private equity (0.40) is comparable to that of publicly traded equity in the US (0.41–0.43). The Sharpe ratio of private real estate materially lags those of the US equity and REIT categories. Hedge funds are conspicuously poor performers. The CEM analysis takes a different approach from that of Andonov, but the results of the two studies closely parallel one another.
Exhibit 1
Sharpe Ratios Reported by CEM Benchmarking
(1998-2020)
|
Asset Class |
Sharpe Ratio |
|
US Bonds |
0.66 |
|
Large Cap US Equity |
0.43 |
|
REITs |
0.42 |
|
Small Cap US Equity |
0.41 |
|
Private Equity |
0.40 |
|
Non-US Equity |
0.32 |
|
Private Real Estate |
0.32 |
|
Hedge Funds (and TAA) |
0.25 |
Source: CEM Benchmarking.
Ennis (2024) calculated total fund alphas for 59 large public funds using rate of return data from the Center for Retirement Research at Boston College. I then examined how small increases in the allocation to alternative investments influenced alpha at the total fund level. In Exhibit 2 we observe that increasing the aggregate exposure to alts had an adverse impact on total fund alpha. That is, substituting alts for stocks and bonds had the effect of reducing alpha. The regression intercept, which corresponds to zero alts, is +0.63%. For every percentage point of assets allocated to alts in the aggregate, there is a corresponding 7.3 bps (and statistically significant) reduction in annualized total fund alpha.
Exhibit 2
Relationship of Public Funds’ Alphas and Aggregate Allocation to Alternative Investments
(13 years ended June 30, 2021)
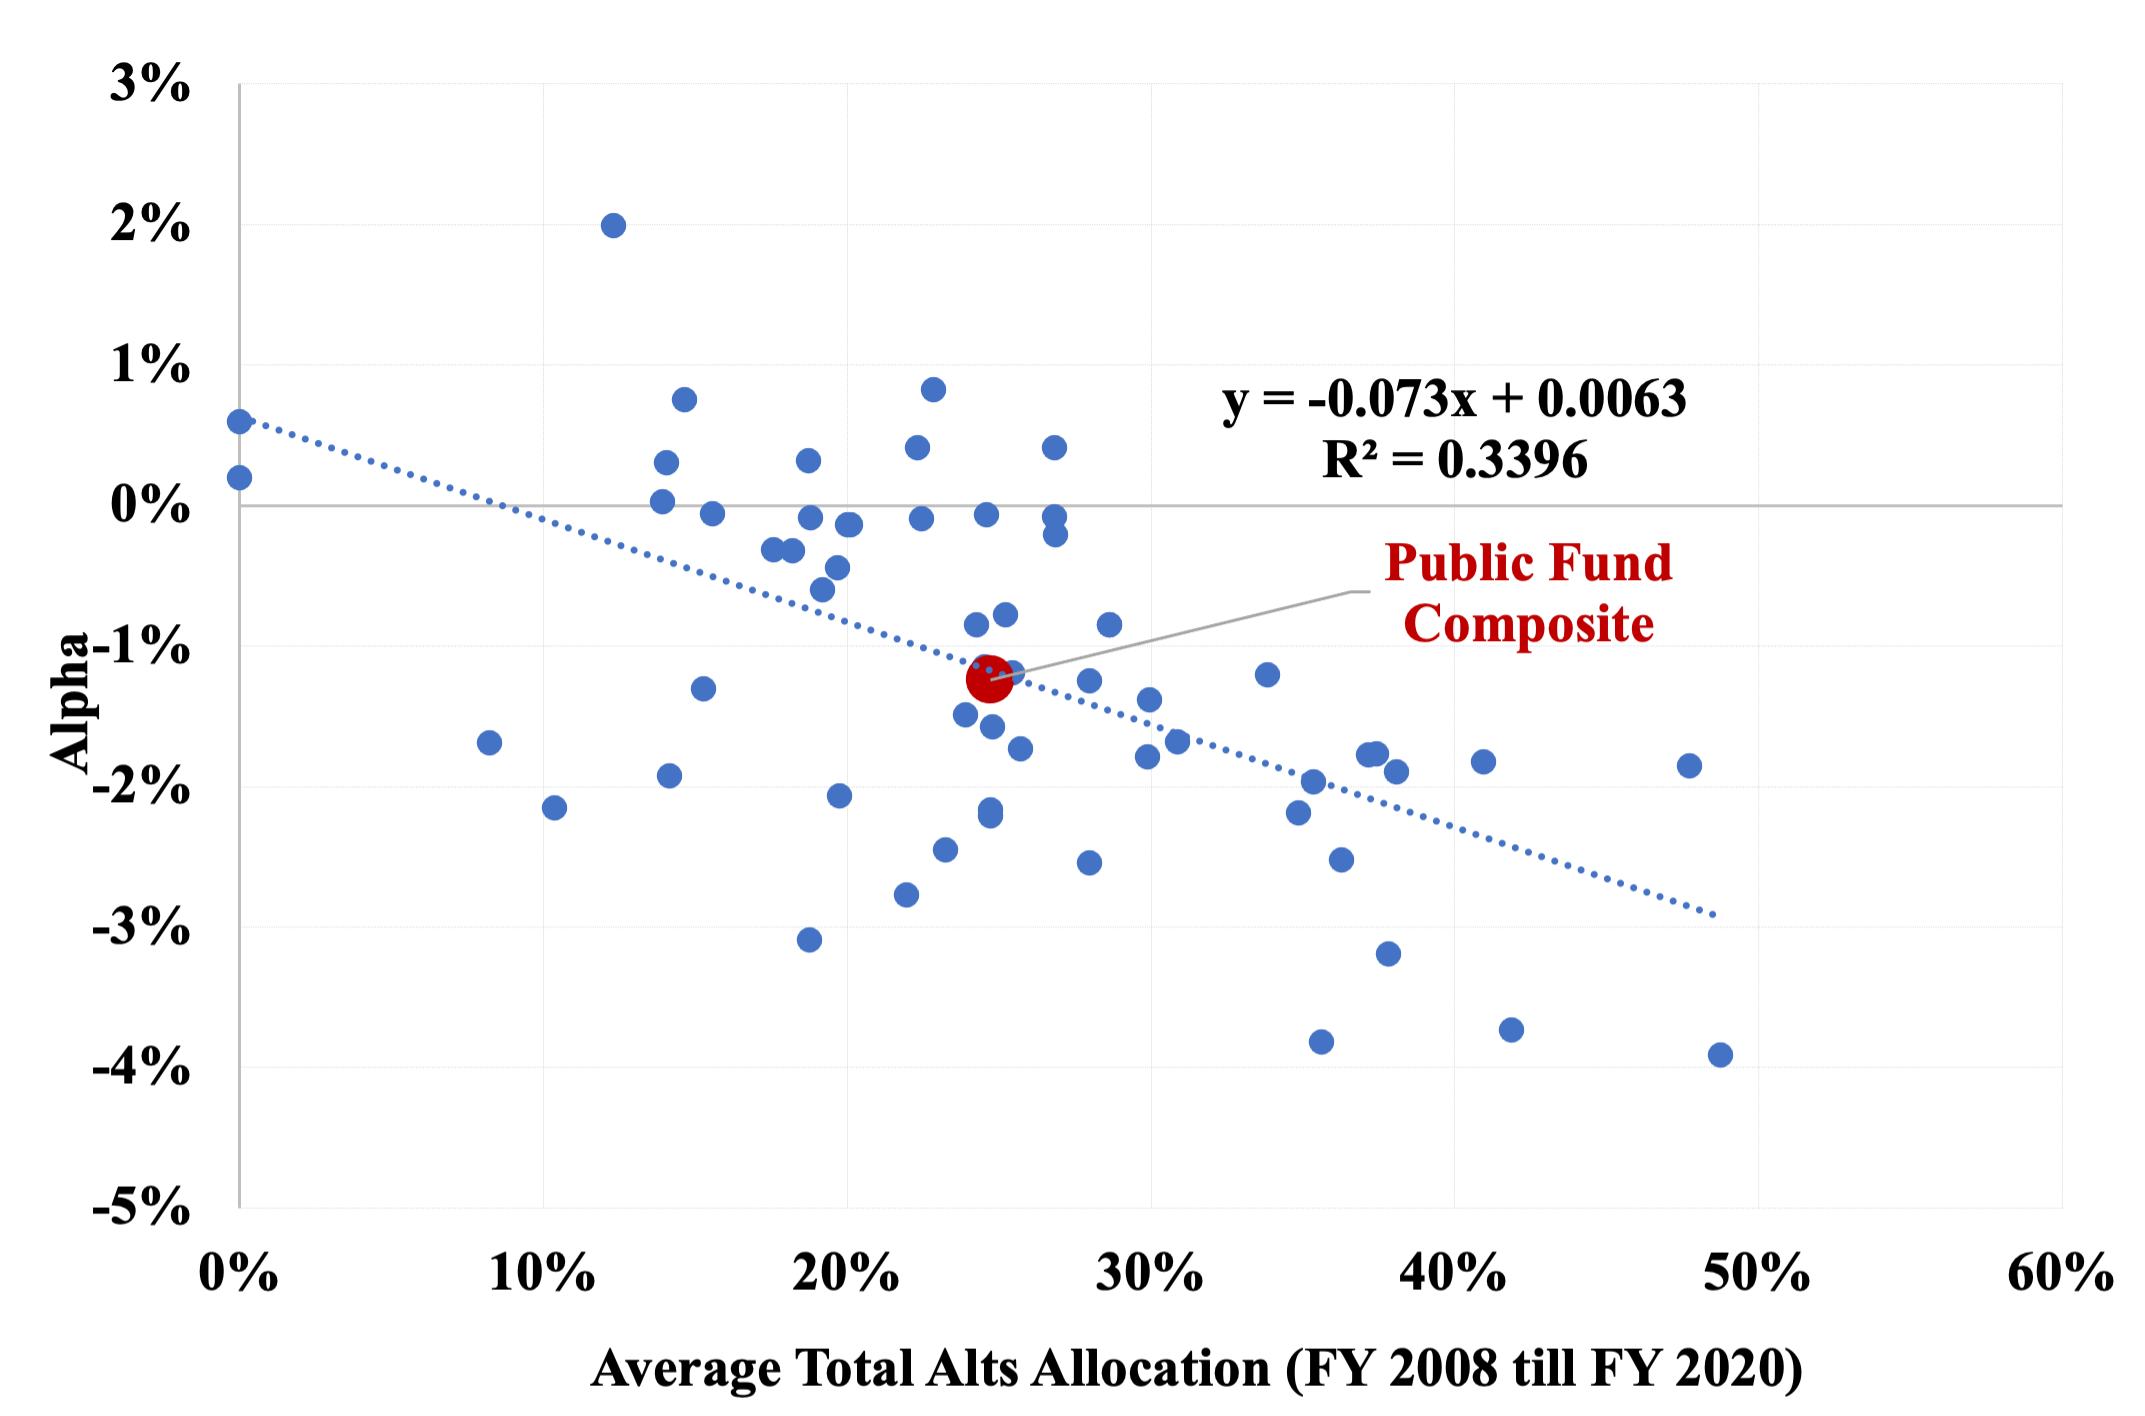
Source: Ennis (2023b)
Careful reading of the three papers summarized here reveals a commonality of their results. They all indicate that the performance of private equity is pretty much neutral relative to that of public equity. While all suggest that public equity may have had a slight edge over private, it would be safer to declare it a toss-up. On the other hand, all three studies indicate that both private equity real estate and hedge funds have been unmistakably poor performers for large defined benefit plans. A more detailed discussion of the performance results for the three types of alternatives is contained in, “Have Alternative Investments Helped or Hurt?” See Ennis (2024).[4]
What accounts for the lackluster performance of alternative investments? Elsewhere, [5] I have written:
High cost must be a partial, at least, explanation, for alts’ weak showing. I estimate that alts cost institutional investors about 10 times as much as traditional stock and bond strategies. My approximate cost figures for alts, in bps annually, are 230 for private real estate (core and core-plus, combined 50-50 with non-core), 300 for hedge funds, 500 for private equity, and 80 for commodities. I estimate the typical public pension fund incurs costs of approximately 30 bps for traditional stock and bond strategies (active and passive combined) and roughly 300 bps for diversified alts. I have estimated the typical annual cost of investing public pension funds, with their current average 30-percentage-point allocation to alts, at approximately 1.2% of assets, which approximates the observed margin of underperformance described here.[6] Given the evolution of alts markets over two decades—becoming more liquid, more competitive, and better integrated with public markets than they were during alts’ heyday in the 1990s and early 2000s—it is no surprise that these costs weigh heavily on investors’ experience with alts.
Published studies of the contribution of alternative investments to diversified, multi-asset-class portfolios indicate that alts have been a drag on performance. These facts have not been widely appreciated in the field of institutional investing.
CALSTRS’S EXPERIENCE WITH ALTERNATIVES
Performance
Next, I sought to determine whether CalSTRS’s own investing experience might justify a large commitment to alternative investments, despite the contrary evidence cited above. The thought here is that perhaps CalSTRS has been an exceptional investor in alternative assets. To do this, I analyzed CalSTRS’s returns during the 15 fiscal years, 2009-2023.[7] I compared CalSTRS’s returns to those of a custom-tailored index of stocks and bonds. The index is 53% Russell 3000 stocks, 23% MSCI ACWI ex-US (hedged) and 24% Bloomberg US Aggregate bonds. The stock-bond benchmark fits, statistically speaking, the CalSTRS’s returns better than any other combination of broad market indexes.[8] The results are shown in Exhibit 3. CalSTRS underperformed the hybrid index by 0.8% per year. Risk, as measured by standard deviation of return, is the same for the two series.[9] Accordingly, CalSTRS exhibits the lower Sharpe ratio of the two, .52 vs. .58.
Exhibit 3
CalSTRS’s performance, 2009-2023
|
|
CalSTRS Return |
Stock-Bond Index Return |
Difference |
|
Annualized Return |
7.0% |
7.8% |
-0.8% |
|
Standard Deviation |
12.2% |
12.3% |
n/a |
|
Sharpe Ratio |
.52 |
.58 |
n/a |
Importantly, the stock-bond index used here meets the criterion for benchmarking investment portfolios established in a seminal article published more than 50 years ago. Fama (1972) proposed that the “returns on managed portfolios be judged relative to those of ‘naively selected’ portfolios with similar levels of risk.” The index fund hadn’t even been devised yet, but the role of passive investment alternatives as the appropriate frame of reference in performance measurement was taking shape. The principal function of a performance benchmark is to enable one to determine whether active investment management is adding value. Hence, academics and serious practitioner-researchers use passive investment benchmarks when trying to get a true fix on performance.
CalSTRS, like most institutions, uses a performance benchmark of its own devising, which it describes as “custom.” Over the 10 years ended June 30, 2023, CalSTRS reports that its total portfolio return slightly exceeded that of its custom benchmark, earning 8.7% annualized vs. 8.4%. It reports essentially matching the custom benchmark return over the last 20 years (8.0% vs. 7.9%).[10] Custom benchmarks are subjective in their construction, at the discretion of those whose performance is being evaluated (investment staff and consultants). They are also typically complex, ambiguously customized, fluid in composition, opaque, and all but indecipherable to readers of financial reports. CalSTRS’s custom benchmark fits this pattern. My research shows that the overwhelming majority of public pension funds’ custom benchmarks produce lower returns than appropriately constructed passive-management ones; average downward bias is 170 bps per year.[11]
A principal concern with the CalSTRS benchmark is that it incorporates significant active-management influences. One way it does this is by including allocations to alternative investments, such as hedge funds and private equity, as benchmark components. These, of course, are themselves active bets. Including active investment components in the benchmark makes it impossible to determine whether active investing has paid off.
Characterization of the performance of custom benchmark components is highly subjective, and there are myriad indexes to choose from. A case in point: Currently, CalSTRS’s long-term private equity bencmark is MSCI ACWI IMI (a global equity index) plus 150 bps per year. From 2008 to 2014, it was Russell 3000 plus 300 bps. Several studies, e.g., Beath and Flynn (2020), Ilmanen et al. (2020), L’Her, et al. (2016), and Phalippou (2020), advocate using a domestic equity benchmark rather than a global one for private equity, arguing that the latter mischaracterizes investments and significantly lowers the bar for them. And, of course, the private market return premium was halved, from 300 to 150 bps.[12]
I believe CalSTRS’s overall underperformance of 0.8% per year is approximately equal to the annual investment expense incurred by CalSTRS over the study period. If this is correct, it is fair to say that CalSTRS underperformed a risk- and market-exposure-matching passive-investment portfolio by roughly the margin of cost. This is what finance theory predicts for diversified portfolios such as that of CalSTRS.
Approximately 72% of CalSTRS’s public stocks and 86% of its bonds are managed passively. With the inclusion of more than two dozen actively managed stock and bond portfolios, the returns of public stock and bond asset classes match or slightly exceed CalSTRS’s public market benchmarks for those portfolios.[13] An implication of this is that the fund’s underperformance of 0.8% per year can reasonably be associated with its non-public, or alternative, investments: If public market investments have market-like-or-better returns, and total portfolio return is below market, the source of the underperformance must be alternative assets. In other words, had alternatives produced market-like returns, the 15-year annualized difference between portfolio and benchmark returns would be approximately zero, not -0.8%. Based on this, it reasonable to infer that CalSTRS’s alternative investments largely account for the underperformance.
In short, the evidence here suggests that CalSTRS’s experience with alternative investments is similar to that of public pension funds in the main: Alternative investments have detracted from performance.
Leverage: An Unintended Consequence
CalSTRS revised its investment policy early in 2024 to permit leveraging the portfolio by up to 10% of its value. It did this to facilitate rebalancing the portfolio among asset classes. With recent market gyrations, CalSTRS’s significant allocation to private assets precluded portfolio rebalancing without liquidating private assets. When public markets decline, CalSTRS is able to purchase marketable securities with borrowed funds to bring the portfolio into conformance with prescribed asset allocation ranges (or at least closer to being so). CalSTRS maintains that the leverage provision is a tool in managing asset allocation, not an attempt to amplify return. They state that leverage would be employed on a temporary basis. Temporary or not, leverage exposes the portfolio to greater potential loss. Whether or not to leverage a portfolio is one of the principal elements of investment policy, along with equity exposure and diversification. But here CalSTRS appears to subordinate this important strategic issue to the rather mundane business of portfolio administration. This doesn’t seem right to me.
CONCLUSION
CalSTRS, already with a large allocation to alternative assets, plans on making additional commitments there. Is this a sound strategic move? Published studies show that the performance of institutional investors such as CalSTRS has suffered as a result of investing in alternatives. CalSTRS’s own track record over the last 15 years indicates that alternative investments have detracted from performance compared to a passive stock-bond investment strategy. The heavy commitment to alternatives also appears to have had an unintended consequence: obliging CalSTRS to borrow against its portfolio in order to maintain its diversification.
Institutional investors ignore the evolved competitiveness of alts markets. They count on a diversification benefit that simply isn’t there. They are not paying close enough attention to corrosive costs. And accommodating benchmarks allow the whole business to continue along its way.
Public pension plans suffer from serious underfunding. Loading up on alternative investments does not appear to be the way to improve the funds’ financial condition. It may be time for public pension funds to rethink investment strategy.
ACKNOWLEDGMENTS
I appreciate helpful comments from various reviewers, including Anonymous, Brian Bruce, Trym Riksen, Trey Shipp and Rodney Sullivan.
REFERENCES
Andonov, A. 2022. “Delegated Investment Management in Alternative Assets.” The Review of Corporate Finance Studies, 00, 1–38.
Beath, A.D. and C. Flynn. 2020. “Benchmarking the Performance of Private Equity Portfolios of the World’s Largest Institutional Investors.” The Journal of Investing pp 67-87.
—— . 2022. “Asset Allocation and Fund Performance of Defined Benefit Pension Funds in the United States, 1998-2020.” CEM Benchmarking.
Ennis, R.M. 2022. “Cost, Performance, and Benchmark Bias of Public Pension Funds in the United States: An Unflattering Portrait.” Journal of Portfolio Management.
——. 2023. “Lies, Damn Lies, and Benchmarks: An Injunction for Trustees.” The Journal of Investing, forthcoming. Available at SSRN: https://ssrn.com/abstract=4253186.
——. 2024. “Have Alternative Investments Helped or Hurt?” The Journal of Investing, 33 (2): 8-16.
Fama, E.F. 1972. “Components of Investment Performance.” The Journal of Finance (Volume 27, No. 3): 551-567.
Ilmanen, A., S. Chandra, and N. McQuinn. 2020. “Demystifying Illiquid Assets: Expected Returns for Private Equity.” The Journal of Alternative Investments 22 (3): 8–22.
L’Her, J.-F., R. Stoyanova, K. Shaw, W. Scott and C. Lai. 2016. “A Bottom-Up Approach to the Risk-Adjusted Performance of the Buyout Fund Market,” Financial Analysts Journal, July-August.
Phalippou, L. 2020. “An Inconvenient Fact: Private Equity Returns & The Billionaire Factory.” University of Oxford, Said Business School, Working Paper, Available at SSRN: https://ssrn.com/abstract=3623820.
Sharpe, W. F. 1988. “Determining a Fund’s Effective Asset Mix.” Investment Management Review (September/October): 16–29.
——— . 1992. “Asset Allocation: Management Style and Performance Measurement.” Journal of Portfolio ManagementWinter: 7-19.
[1] March 7, 2024. https://www.pionline.com/pension-funds/calstrs-weigh-new-opportunistic-sleeve-eliminates-55-limit-private-assets
[2] I have been an admirer of CalSTRS investment management over the years and remain so. However, the fund’s size and prominence, combined with developments described here, make it a very important public fund investment strategy case for study at this juncture.
[3] See Beath and Flynn (2022).
[4] Hedge funds seem to be a particularly poor choice for long-term investors such as pension and endowment funds. Not only do they exhibit poor performance in their own right, the effective equity exposure of a diversified portfolio of them is typically on the order of 0.5, so they shouldn’t be expected to keep up with equities over the long run. Their market exposures can typically be achieved with a combination of stocks and bonds. Hedge funds are a pure play on beating the market while investing in marketable securities, a strategy that costs 2–3% of asset value annually.
[5] Ennis (2024).
[6] See Ennis (2022) for cost details.
[7] I begin the analysis in fiscal year 2009 to address a significant return-smoothing issue. Prior to an accounting rule change in 2008, private assets were valued at book. The rule change required that a market-basis of valuation be used. There is evidence of return smoothing prior to 2009 that ceases to exist after the rule change. The return smoothing appears to have created an upward bias in public pension fund returns in the period 2001 to 2008.
[8] The benchmark is derived using quadratic programming. See Sharpe (1988, 1992).
[9] The standard deviation for CalSTRS is biased downward as a result of the smoothing of returns associated with private assets. This effect is especially evident in the last two years of the study, 2022 and 2023.
[10] See CalSTRS Annual Comprehensive Financial Report for the Fiscal Year Ended June 30, 2023, p. 105.
[11] See Ennis (2023).
[12] Another significant benchmarking issue is CalSTRS’s use of component benchmarks that are not investable. (This, by the way, is a universal problem with custom benchmarking, not just a CalSTRS phenomenon.) The real estate benchmark is the NCREIF ODCE Index. So-called risk-mitigating strategies are compared to hedge fund manager return indexes published by Hedge Fund Research and Societe Generale prime brokerage services. The “innovative strategies” asset class uses CalSTRS’s actuarial rate of return assumption as its long-term benchmark. All of these are purely hypothetical; it is not possible to secure the return of any of them.
[13] CalSTRS Annual Comprehensive Financial Report for the Fiscal Year Ended June 30, 2023, pp. 105-107.

