Hogwarts Finance
Here are examples of practice sharply at odds with the theory and evidence of finance:
- Supposedly sophisticated institutional fund managers have just a small fraction of their assets in index funds or other low-cost passive portfolios. They do so despite overwhelming evidence dating back to before most of them were born that active management is a losing proposition.[1] The body of evidence includes studies of the performance of their own portfolios.[2] Believing they will beat the market while actively managing massive, extremely diversified, costly portfolios is magical thinking that costs beneficiaries dearly.
- The First Law of Active Management: Never diversify with active managers. Active bets tend to offset one another, leaving the investor with an expensive closet index fund. Large institutional investors blithely ignore this Law, using more than 100 managers. No wonder they underperform by the full margin of their cost.[3] To succeed, they must achieve diversification using near costless index funds. They must pare manager rosters unmercifully. There is no philosopher’s stone for creating alpha.
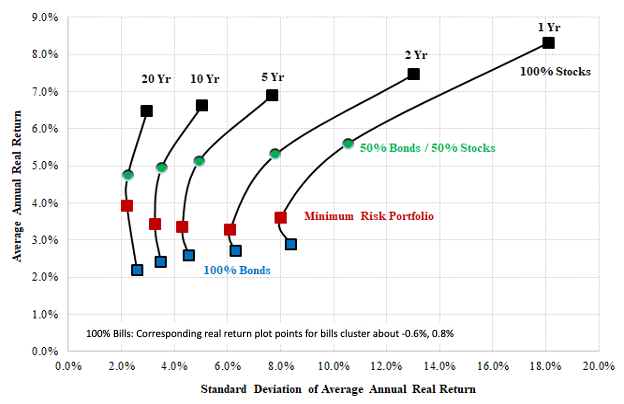
- Institutional investors conflate active investment strategies with asset classes. Stocks, government bonds and bills are bona fide asset classes, differing from one another in their essential design: bills provide a one-period-certain return; bonds provide multi-period-certain returns but fluctuate in value moderately with interest rates; stocks entitle investors to the uncertain fruits of enterprise. The concreteness and very legitimacy of these asset classes is bolstered by securities law, accounting standards, federal regulation, and continuous auction-market pricing, plus extensive, detailed and publicly available documentation of important facts. They exhibit reliably different levels of return variability across a wide spectrum. Greater expected return goes hand in hand with greater return variability. Stock, bond and bill returns are uncorrelated with one another over the long run.[4] These asset classes have shown themselves to be reliable building blocks in realizing efficient portfolio architecture. See Exhibit 1.
Exhibit 1
The Stock-Bond Diversification Effect
(Periods ended December 31, 2019)
Successful active investment strategies are comparatively short-lived. They represent transactions, or deals, as much as assets. Their ex-ante merit is predicated on a subjective outlook. Their success depends on selection skill or luck. There is no way to access them cheaply. In sum, in comparison with actual asset classes, active strategies are nebulous, even when having proved profitable. CIOs and consultant-advisors have sought to imbue various active strategies—particularly those involving alternative investments—with the properties of asset classes in order to justify them as permanent parts of the portfolio—as policy assets, as it were (like stocks, bonds and bills). Heavy allocations to alternative investments rely on a sorcerer’s illusion that the returns of alternatives are uncorrelated with those of common stocks. Apart from the effects of stale pricing, which results from lags in marking illiquid assets to market, nothing could be further from the truth. Private equity, private-market real estate and hedge funds have exhibited correlation (r) with US stocks of 0.96, 0.85 and 0.96, respectively, since the GFC.[5] Diversified portfolios of alternative investments behave like diversified portfolios of stocks and bonds but cost about 10 times as much. As a result, under the guise of being diversifiers affording investors a “free lunch,” alternatives have proven to be the main drag on institutional fund performance.[6]
- CIOs and consultant-advisors relentlessly claim beta-type returns as earned alpha. This happens when they compare their total portfolio return to “60-40” while their effective equity exposure is actually 70% to 80%.[7] This happens when they compare their 50%-leveraged private real estate portfolio to a benchmark with no or low leverage. And this happens when they compare their high-yield-inclusive portfolios to an investment-grade bond index. And so it goes. All are attempts to have a frog pass for a prince.
- In a seminal article more than 50 years ago, Gene Fama established the logical basis for benchmarking investment portfolios when he proposed that “the returns on managed portfolios be judged relative to those of ‘naively selected’ portfolios with similar levels of risk.”[8] The index fund hadn’t even been devised yet, but the role of passive investment alternatives as the appropriate frame of reference in performance measurement was looming. The principal function of the benchmark is to enable one to determine whether investment management is adding value. In my work I evaluate the performance of institutional funds using what I describe as “appropriately constructed passive investment benchmarks.” These are combinations of a few broad market indexes that best match the risk level and principal market exposures of funds I study.
CIOs and consultant-advisors, however, rarely submit to this standard in performance reporting. (It would be lethal.) Most have opted for “custom” benchmarks of their own devising. Custom benchmarking is a black art, to be sure. These benchmarks are invariably subjective in their construction, usually very complex, ambiguously customized, fluid in composition, opaque, and all but indecipherable to readers of financial reports. (The appendix contains an example of a custom benchmark.) I estimate that the average return of custom benchmarks is biased downward by 150 bps a year compared to index-based benchmarks.[9] As a gauge of financial performance, custom benchmarks are an economist’s worst nightmare—and perhaps the wizards’ greatest achievement.
- Roughly 3 in 10 large public pensions in the US still report their investment returns without deducting all their investment expenses. This does make things look better, that’s for sure. But it is a departure from sound professional practice and common sense. Pension benefits and university expenses can only be paid from netreturns. And then there is the cost of operating the investment office, which is almost never deducted from the fund’s return. This additional cost can run 30-60 bps a year. To be taken seriously, institutional investors should report their returns net of all expenses.
I have described just a few of the failings in the design, implementation and measurement of institutional investment portfolios. Fund management is riddled with them. I estimate the resulting economic inefficiency costs beneficiaries in the US at least $100 billion a year. Why does this persist? Are we not educated and credentialed professionals? Are we not stewards of others’ assets? Is it not time to put the wizard’s grimoire aside and take the investments textbook down from the shelf?
APPENDIX
NEW MEXICO PUBLIC EMPLOYEES RETIREMENT ASSOCIATION CUSTOM BENCHMARK
The following is taken verbatim from New Mexico PERA Annual Comprehensive Financial Report, 2022, p. 134.
The Total Fund Benchmark consists of:
- 27% Russell 3000 Index, 27% MSCI ACW Ex US Blended Index (Gross), 25% LB Aggregate Bond Index, 5% 3 Mo LIBOR Index + 4%, 5% Venture Economics All Private Equity Index (lagged one quarter), 2.5% NCREIF Property Index, and 2.5% CPI +5% from 6/30/2007 until 10/31/2009;
- 35% Russell 3000 Index, 25% MSCI ACW Ex US Blended Index (Gross), 25% Barclays Global Aggregate Blended Index, 5% 3 Mo LIBOR Index + 4%, 5% Venture Economics All Private Equity Index (lagged one quarter), 2.5% NCREIF Property Index, 1% Barclays US TIPS Index, 1% S&P GSCI Light Energy Index, and 0.5% CPI +5% until 06/30/2010;
- 27% Russell 3000 Index, 27% MSCI ACW Ex US Blended Index (Gross), 26% Barclays Global Aggregate Blended Index, 9% HFRI Fund of Funds Composite Index, 5% Private Equity Custom Index, 3% Real Estate Custom Index, and 3% Real Assets Custom Index until 11/30/2012;
- 29% Russell 3000 Index, 20% Int'l Equity Custom Index, 26% Fixed Income Custom Index, 5% Liquid Alpha Index, 7% HFRI Fund of Funds Composite Index, 5% Private Equity Custom Index, 3% Real Estate Custom Index, and 5% Real Assets Custom Index until 8/31/2014;
- 21.1% Russell 3000 Index, 24.8% International Equity Custom Index, 26.1% Core and Global Fixed Income Custom Index, 5% Fixed Income Plus Sectors Custom Index, 4% HFRI Fund of Funds Composite Index, 7% Private Equity Custom Index, 5% Real Estate Custom Index, and 7% Real Assets Custom Index until 04/30/2016;
- 43.5% Global Equity, 21.5% Risk Reduction & Mitigation, 15% Credit Oriented Fixed Income, and 20% Real Assets until 4/30/2019;
- 42.8% Global Equity, 21.5% Risk Reduction & Mitigation, 15% Credit Oriented Fixed Income, 20% Real Assets and 0.7% Multi-Risk Custom Index until 5/31/2019;
- 42.3% Global Equity, 21.4% Risk Reduction & Mitigation, 15% Credit Oriented Fixed Income, 20% Real Assets custom index and 1.3% Multi-Risk Custom Index until 6/30/2019;
- 41% Global Equity, 21% Risk Reduction & Mitigation, 15% Credit Oriented Fixed Income, 20% Real Assets custom index and 3% Multi-Risk Custom Index until 9/30/19;
- 35.5% Global Equity, 19.5% Risk Reduction & Mitigation, 15% Credit Oriented Fixed Income, 20% Real Assets custom index and 7.0% Multi-Risk Custom Index until current.
The Global Equity Benchmark consists of:
- 75% MSCI ACWI IMI ($N), 20% Russell 3000 1QA +3%, and 5% HRFI Equity Hedge (Total) 4/30/2013 until 6/30/2015;
- 20% Russell 3000 1QA +3%, 5% HRFI Equity Hedge (Total) Index, 65% MSCI ACWI IMI ($N), and 10% MSCI ACWI Minimum Volatility ($N) until 12/31/2017;
- 65% MSCI ACWI IMI ($N), 20% Russell 3000, and 15% MSCI ACWI Minimum Volatility ($N) until 12/31/2018;
- 84% MSCI ACWI IMI ($N), and 16% MSCI ACWI Minimum Volatility ($N) until 5/31/2019;
- 83% MSCI ACWI IMI ($N), and 17% MSCI ACWI Minimum Volatility ($N) until 10/31/19;
- 82% MSCI ACWI IMI ($N), and 18% MSCI ACWI Minimum Volatility ($N) until 2/29/20; and 80% MSCI ACWI IMI ($N), and 20% MSCI ACWI Minimum Volatility ($N).
The Risk Reduction & Mitigation Benchmark consists of:
- 86% Bloomberg Barclays U.S. Aggregate Bond Index, 2% ICE BofAML 3 Month US Treasury Bill, and 12% Bloomberg Barclays Global Aggregate Hedged until 12/31/2018;
- 88% Bloomberg Barclays U.S. Aggregate Bond Index and 12% Bloomberg Barclays Global Aggregate bond Index until 6/30/19;
- 87% Bloomberg Barclays U.S. Aggregate Bond Index and 13% Bloomberg Barclays Global Aggregate bond Index.
The Credit Oriented Fixed Income Benchmark consists of:
- 20% Bloomberg Barclays Global High Yield, 20% HFRI Credit Index 1MA, 40% Bloomberg Barclays Global High Yield + 1% 1QA, and 20% JP Morgan Emerging Markets Bond until 12/31/2017;
- 80% Bloomberg Global High Yield and 20% JP Morgan Emerging Markets Bond (50% JP Morgan EMBI Global Diversified ($) / 50% JP Morgan GBI ($)) and
- 80% Bloomberg Global High Yield and 10% JP Morgan EMBI Global Diversified ($) and 10% JP Morgan GBI ($) until current.
The Real Assets Benchmark consists of:
- 42% Cambridge Associates Natural Resource Index 1QA, 38% NCREIF ODCE +1% 1QA, 10% Alerian MLP, 5% LIBOR + 2% 1MA, and 5% Wilshire Global REIT Total Return Index from 5/01/2016 until 12/31/2017;
- 35% Wilshire Global Real Estate Securities Index, 25% Bloomberg Commodity Index Total Return, 15% Bloomberg Barclays U.S. TIPS, 15% Dow Jones Brookfield Global Infrastructure, and 10% Alerian MLP until 12/31/2018; and
- 35% Wilshire Global REIT Index, 25% Bloomberg Commodity Index Total Return, 15% Bloomberg Barclays U.S. TIPS, 15% Dow Jones Brookfield Global Infrastructure, and 10% Alerian MLP Index until current.
The Multi Risk Allocation consist[s] of 100% Wilshire Risk Parity Index 15% [Target Volatility].
REFERENCES
Ennis, R.M. 2022a. “Are Endowment Managers Better than the Rest?” The Journal of Investing, 31 (6) 7-12.
——. 2022b. “The Modern Endowment Story: A Ubiquitous Equity Factor.” The Journal of Portfolio Management, 49 (1) 107-117.
——. 2023. “Lies, Damn Lies and Benchmarks: An Injunction for Trustees.” The Journal of Investing 32 (4) 6-16.
——. 2024a. “Have Alternative Investments Helped or Hurt?” The Journal of Investing (forthcoming). Available at https://papers.ssrn.com/sol3/papers.cfm?abstract_id=4531038.
——. 2024b. “Endowments in the Casino: Even the Whales Lose at the Alts Table.” The Journal of Investing (forthcoming). Available at https://papers.ssrn.com/sol3/papers.cfm?abstract_id=4578729.
Fama, E.F. 1972. “Components of Investment Performance.” The Journal of Finance (Volume 27, No. 3): 551-567.
Ibbotson, R.G. and J.P. Harrington. 2021. Stocks, Bonds, Bills and Inflation. CFA Institute.
Jensen, M. C. 1968. “The Performance of Mutual Funds in the Period 1945–1964.” The Journal of Finance 23 (2): 389–416.
Sharpe, W. F. 1966. “Mutual Fund Performance.” The Journal of Business 39: 119–138.
[1] See Sharpe (1966) and Jensen (1968).
[2] See Ennis (2022a).
[3] See Ennis (2022a).
[4] The correlation coefficient of US stocks and government bonds has averaged 0.01 over the very long run according to Stocks, Bonds, Bills and Inflation. See Ibbotson and Harrington (2021).
[5] Ennis (2022b)
[6] See Ennis (2024a and 2024b).
[7] I recently examined the performance of a large pension fund over a recent 13-year period. Its actual historical return series exhibits an effective stock-bond exposure of 79-21 using returns-based analysis. Its custom benchmark, however, exhibits an exposure of 63-37–16 full percentage points less in equities. The difference in annualized return between the two series is 3.4 percentage points per year.
[8] See Fama (1972).
[9] See Ennis (2023).

