Endowments in the Casino: Even the Whales Lose at the Alts Table
“Have Alternative Investments Helped or Hurt?” (Ennis 2023b) examined the impact of alternative investments (“alts”) on the performance of US public-sector pension funds. That paper revealed that, since the Global Financial Crisis of 2008 (GFC), public funds realized a negative alpha of approximately 1.2% per year, virtually all of which was associated with their exposure to alternative investments. While exposure to private equity neither helped nor hurt, both real estate and hedge fund exposures detracted significantly from performance. That paper concluded that institutional investors should consider whether continuing to invest in alts warrants the time, expense and reduced liquidity associated with them. This paper examines alts’ impact on the performance of college and university endowments in the US using data from National Association of College and University Business Officers (NACUBO). It concludes that, since the GFC, alts have had a strongly adverse effect on performance across the endowment size spectrum.
ENDOWMENT PERFORMANCE
NACUBO provides no return data for individual school endowments. It does, however, summarize return and asset allocation data for various cohorts of endowment asset value.[1] Exhibit 1 indicates that larger funds have earned greater returns than smaller ones, an oft-noted fact in discussing endowment performance. At the same time, it shows that larger endowments have a greater standard deviation of return, with the consequence that their risk-adjusted return, or Sharpe ratio, is really no greater than those of the smaller ones. In other words, large endowments earn more because they take more risk.
Exhibit 1
Endowment Statistics
(13 years ended June 30, 2021)
|
Cohort ofAsset Value
|
Number of Funds |
Average Allocation to Alts |
Total Annualized Return |
Standard Deviation of Return |
Sharpe Ratio |
|
1. <$25 million |
73 |
10.4% |
6.6% |
10.2% |
0.60 |
|
2. $25-50 |
103 |
16.6 |
6.6 |
11.3 |
0.54 |
|
3. $51-100 |
154 |
22.6 |
6.4 |
11.3 |
0.53 |
|
4. $101-500 |
283 |
33.5 |
6.7 |
12.1 |
0.51 |
|
5. $501-1,000 |
85 |
43.3 |
7.1 |
12.6 |
0.53 |
|
6. >$1 billion |
104 |
59.1 |
7.8 |
13.4 |
0.55 |
Source: NACUBO is the primary source. The average allocation to alts is based on
NACUBO data, averaged over the study period. Other figures are the author’s
calculations.
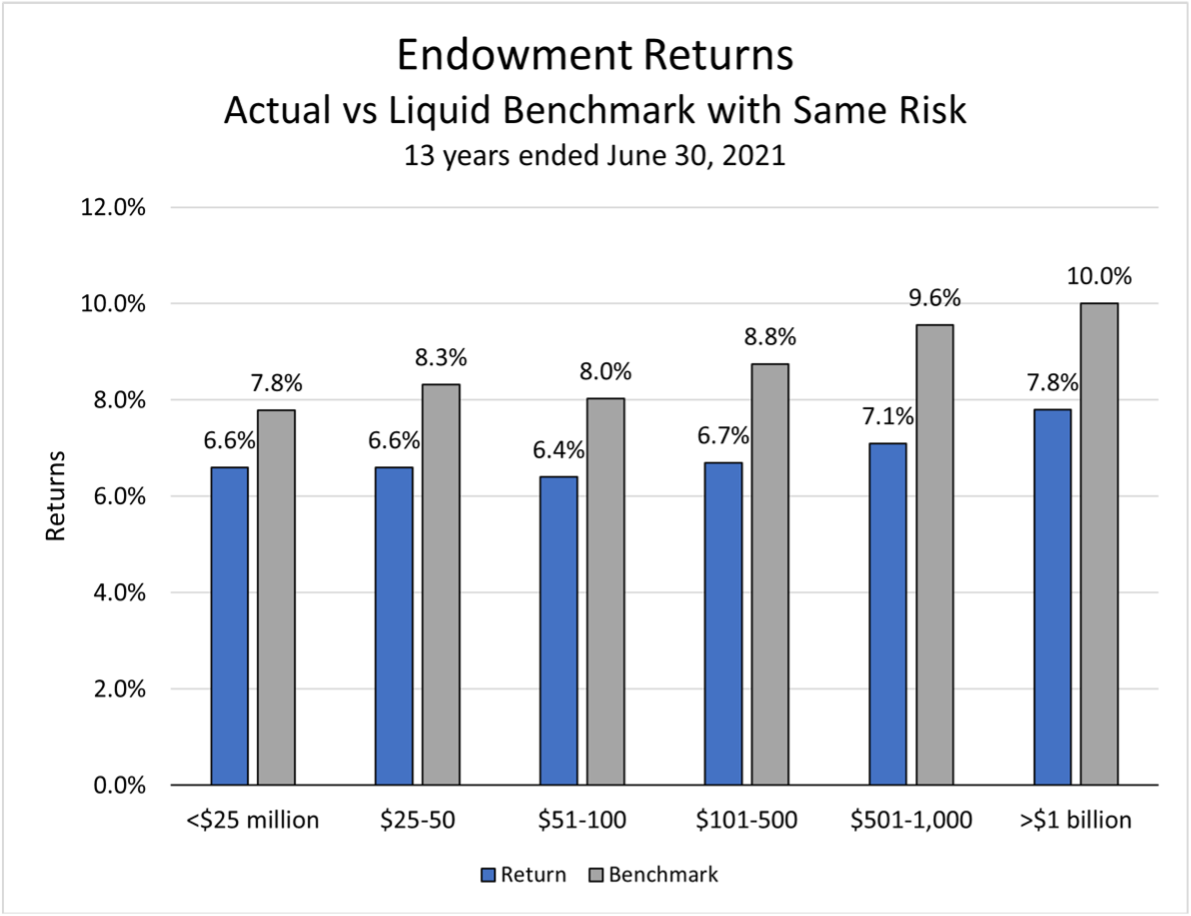
In addition to comparing Sharpe ratios, I create a passively investable benchmark for each of the six endowment groupings using returns-based style analysis (RBSA). RBSA statistically fits the annual returns of various stock and bond indexes to the return pattern of a particular institutional portfolio (or composite of them) using quadratic programming (Sharpe 1988, 1992).[2] It results in a hybrid market index (with static proportions through time) that explains the performance of the subject return series as well or better than any other fixed combination of market indexes.[3] Then, I compare the subject return series to that of the RBSA index to estimate value-added over passive investment, i.e., alpha. Exhibit 2 confirms that large endowments operate at a greater level of risk than smaller ones. They have an average observed equity exposure greater than 80% over the study period, compared with an average of about 70% for the smaller ones. Statistics for R2 and standard error of regression indicate the extraordinary extent to which a few broad market indexes explain the return behavior of endowments.[4] These statistics indicate the negligible effect alts have had in diversifying away from stock market risk. Last but not least, Exhibit 2 reveals large and statistically significant negative alphas across the size spectrum. Exhibit 3 graphically illustrates endowments’ underperformance of 1.2 to 2.5 percentage points per year since the GFC. These results are consistent with ones reported in my earlier work.[5]
Exhibit 2
Results of Returns-Based Style Analysis
|
Cohort of Asset Value
|
Effective 13-Year Equity Exposure* |
R2 of Return with Market Indexes |
Standard Error of Regression |
13-Year Annualized Alpha |
Alpha t- Statistic |
|
1. <$25 million |
66% |
99.6% |
0.6% |
-1.19% |
-5.1 |
|
2. $25-50 |
71 |
99.7 |
0.6 |
-1.72 |
-7.4 |
|
3. $51-100 |
71 |
99.8 |
0.6 |
-1.63 |
-8.1 |
|
4. $101-500 |
76 |
99.4 |
1.0 |
-2.05 |
-6.0 |
|
5. $501-1,000 |
80 |
98.3 |
1.7 |
-2.46 |
-4.0 |
|
6. >$1 billion |
83 |
97.6 |
2.2 |
-2.21 |
-2.8 |
* This is the sum of US and non-US equity market exposures determined by means of RBSA.
Exhibit 3
Endowment Returns Compared to Benchmark
A reviewer of this paper observed, aptly no doubt, that:
“…[M]any CIOs, if shown this analysis, would respond that the period between GFC to 2021 was unique because of zero/negative real bond yields with steady growth for most of that time. Because of ZIRP [zero interest rate policy], public equities rose to nosebleed valuations while hedge funds in particular showed awful performance.”
Let us examine this statement critically. Capital market theory tells us that venture capital, leveraged buyouts and the leveraged private-market real estate favored by most endowment managers are equity investments with healthy betas of their own. No serious research indicates a disconnect between these equity market segments and public equities, certainly not one lasting more than a decade. Exhibit 4, from “The Fairy Tale of Alternative Investments” (Ennis, 2022), shows that the unsatisfactory returns of alts in the post-GFC period can be attributed to negative alpha, not absent beta.
Exhibit 4
Performance Statistics for Private Equity, Hedge Funds,
and Real Estate During the Bull Market Beginning in 2009
|
|
Private Equity
|
Hedge Funds |
Real Estate |
|
Effective Equity Exposure |
100% |
43% |
100% |
|
Alpha (annualized) |
-0.9% |
-3.1% |
-6.0% |
|
R2 with Russell 3000 Stocks |
81% |
89% |
77% |
The return-dampening influence of hedge funds, with an observed equity exposure of about 40% (typical for diversified hedge fund portfolios), is reflected in the custom benchmarking process used here with a commensurately greater allocation to much-lower-returning bonds in the benchmarks. This lowers the performance measurement bar accordingly. So, I don’t buy the notion of a rogue S&P 500 causing havoc for alt investors. No, what I hear the hypothetical endowment manager saying is, “It wasn’t our market,” an age-old justification of underperforming active managers.[6] The real question for endowment managers is whether there is reason to expect a return to the good old days of alt-investing that existed prior to the GFC. I am skeptical.
HOW ALTS IMPACT PERFORMANCE
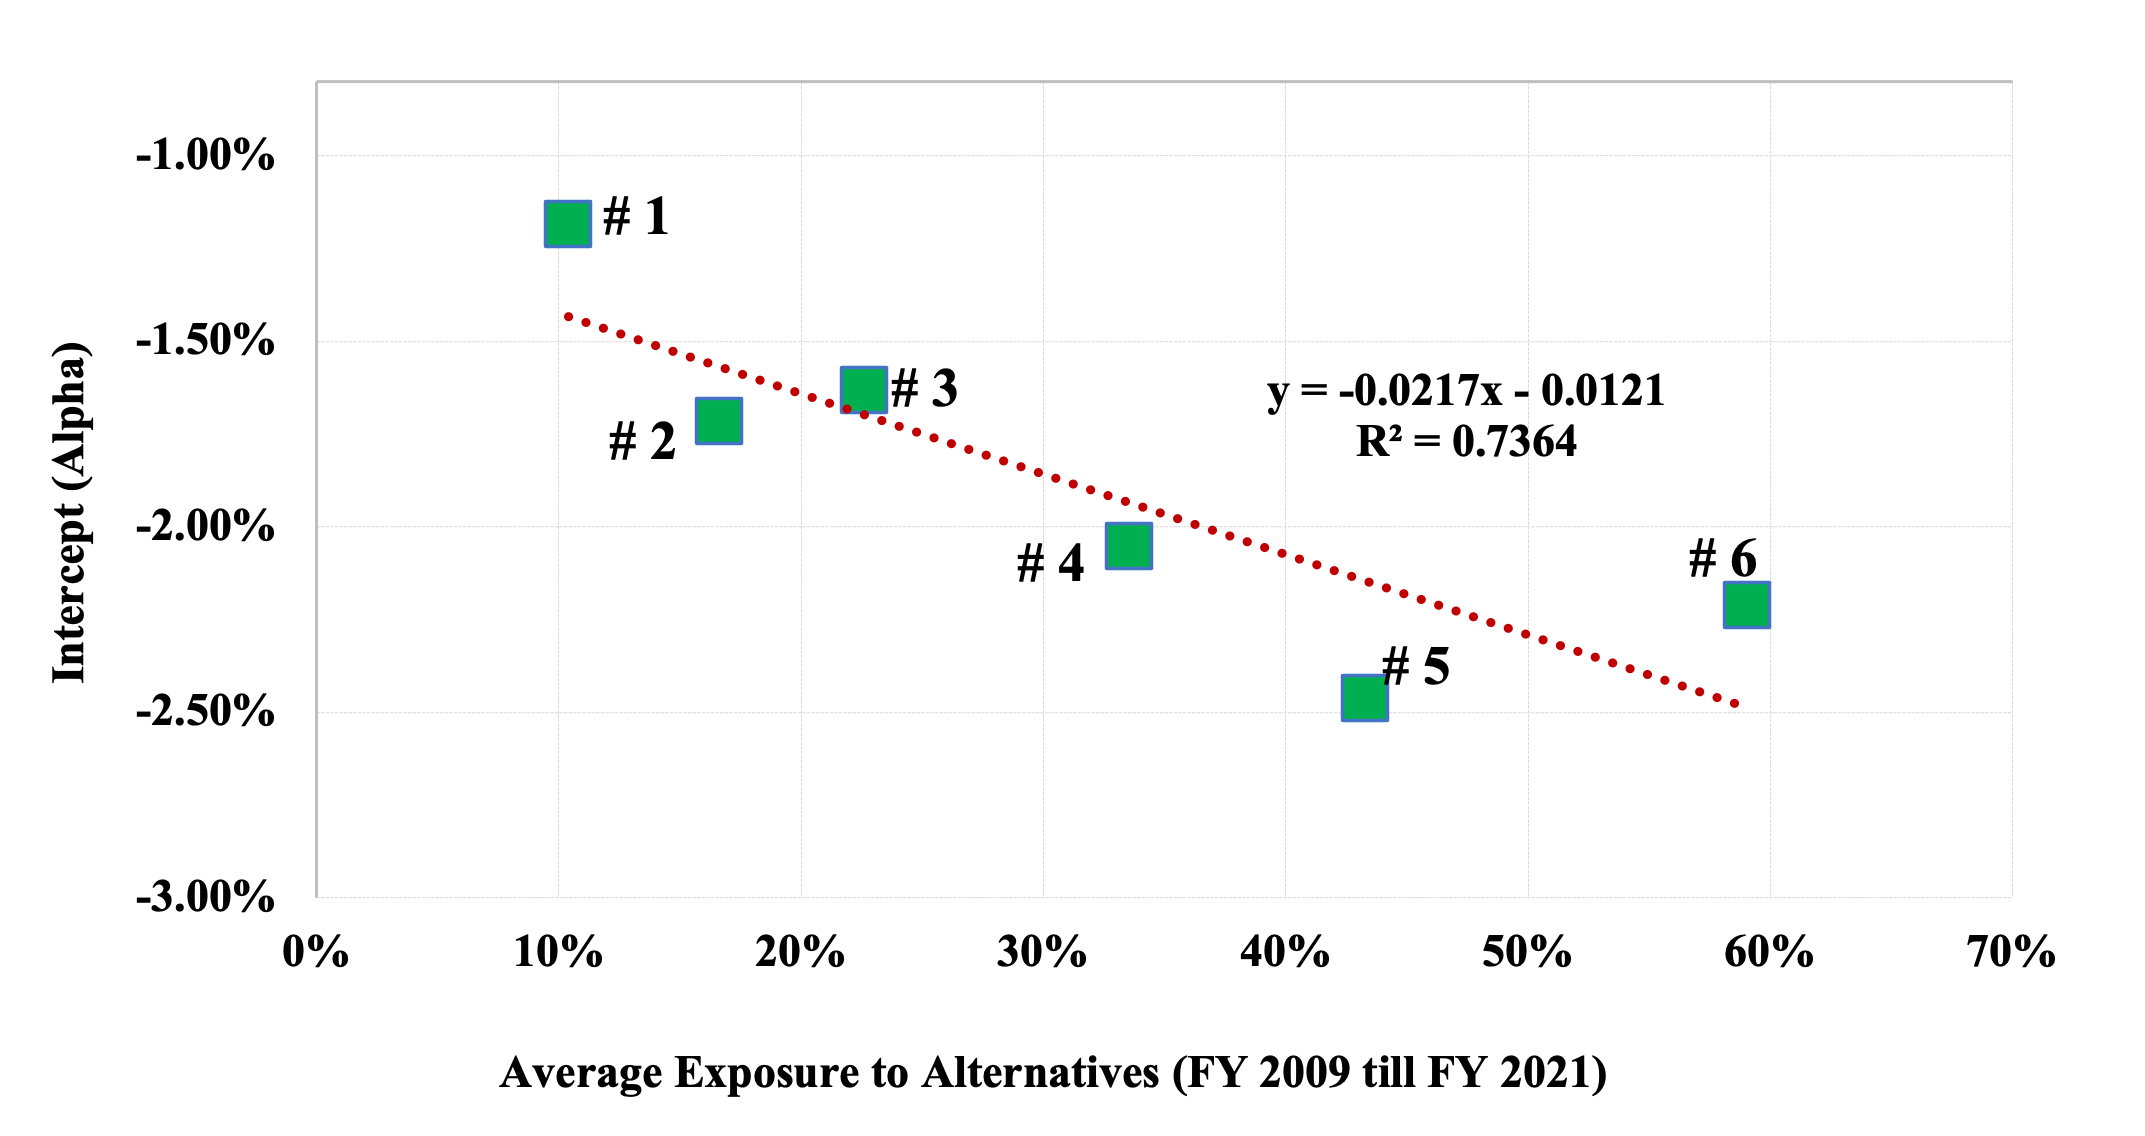
Here, I examine the influence of alt investing on observed alphas. Exhibit 5 illustrates simple linear regression of alpha on each cohort’s average allocation to alternative investments over the study period. It tells us how substituting alts for stocks and bonds across the spectrum of alts exposure affects alpha. Each numbered plot point represents a size cohort, from smallest (left) to largest (right). For every percentage point increase in the allocation to alts in the aggregate, there is a reduction in alpha of 2.2 bps. (The R2 of the regression is 74%. The t-statistic of the slope coefficient is -3.4, indicating ample statistical significance. Tracking error is 0.3%.) Exhibit 5 indicates that substituting alts for stocks and bonds had a significantly adverse effect on performance (alpha) in the post-GFC era.
Exhibit 5
Relationship of Alpha and Exposure to Alts Across Spectrum of Asset Value
So here we have it: Alternative investments, widely thought to be important sources of value-added among endowment investors, have long ceased to be such. Indeed, alts have been a significant and consistent source of underperformance since the GFC. (The degree of statistical significance associated with these results, as cited in Exhibit 2, is striking.) Also, and importantly, we see that large endowments have garnered greater returns than small ones notthrough their alt-investing but through greater risk-taking.
In my opinion, two forces are at work here. One is the high cost of alt investments. The other is the evolution of alt-investing markets over the last two decades. Regarding cost, I have written:
High cost must be a partial, at least, explanation, for alts’ weak showing. I estimate that alts cost institutional investors about 10 times as much as traditional stock and bond strategies. My approximate cost figures for alts, in bps annually, are 230 for private real estate (core combined 50-50 with non-core), 300 for hedge funds, 500 for private equity, and 80 for commodities. I estimate ... [the typical large endowment] incurs costs of roughly 300 bps for a diversified portfolio of alts [Ennis, 2023].
In a prior paper, I discussed the evolution of alts’ investment markets during the last two decades (Ennis, 2020). That era witnessed the entry of countless new players and huge cash inflows into what had been small, illiquid areas of investment. Alts markets became more liquid and more competitive (efficient), and private-market-asset valuations rose markedly. Easy- money opportunities disappeared. The combination of high cost and market evolution made much of alt-investing uneconomic—a pretty simple story, really.
Ennis (2023b) went beyond evaluating public pension funds’ experience with alternative investments in the aggregate as I have done here. Using data for individual funds, it parsed the aggregate alts experience by subcategory, namely, by separately examining the experience of private equity, real estate and hedge fund investments using individual fund data. Unfortunately, NACUBO does not include return or asset allocation data for individual endowments. Without that level of detail, we are left to examine the impact of alts on aggregations of fund return, as done here.
OUTLIERS: THE CURSE OF PYRRHUS?
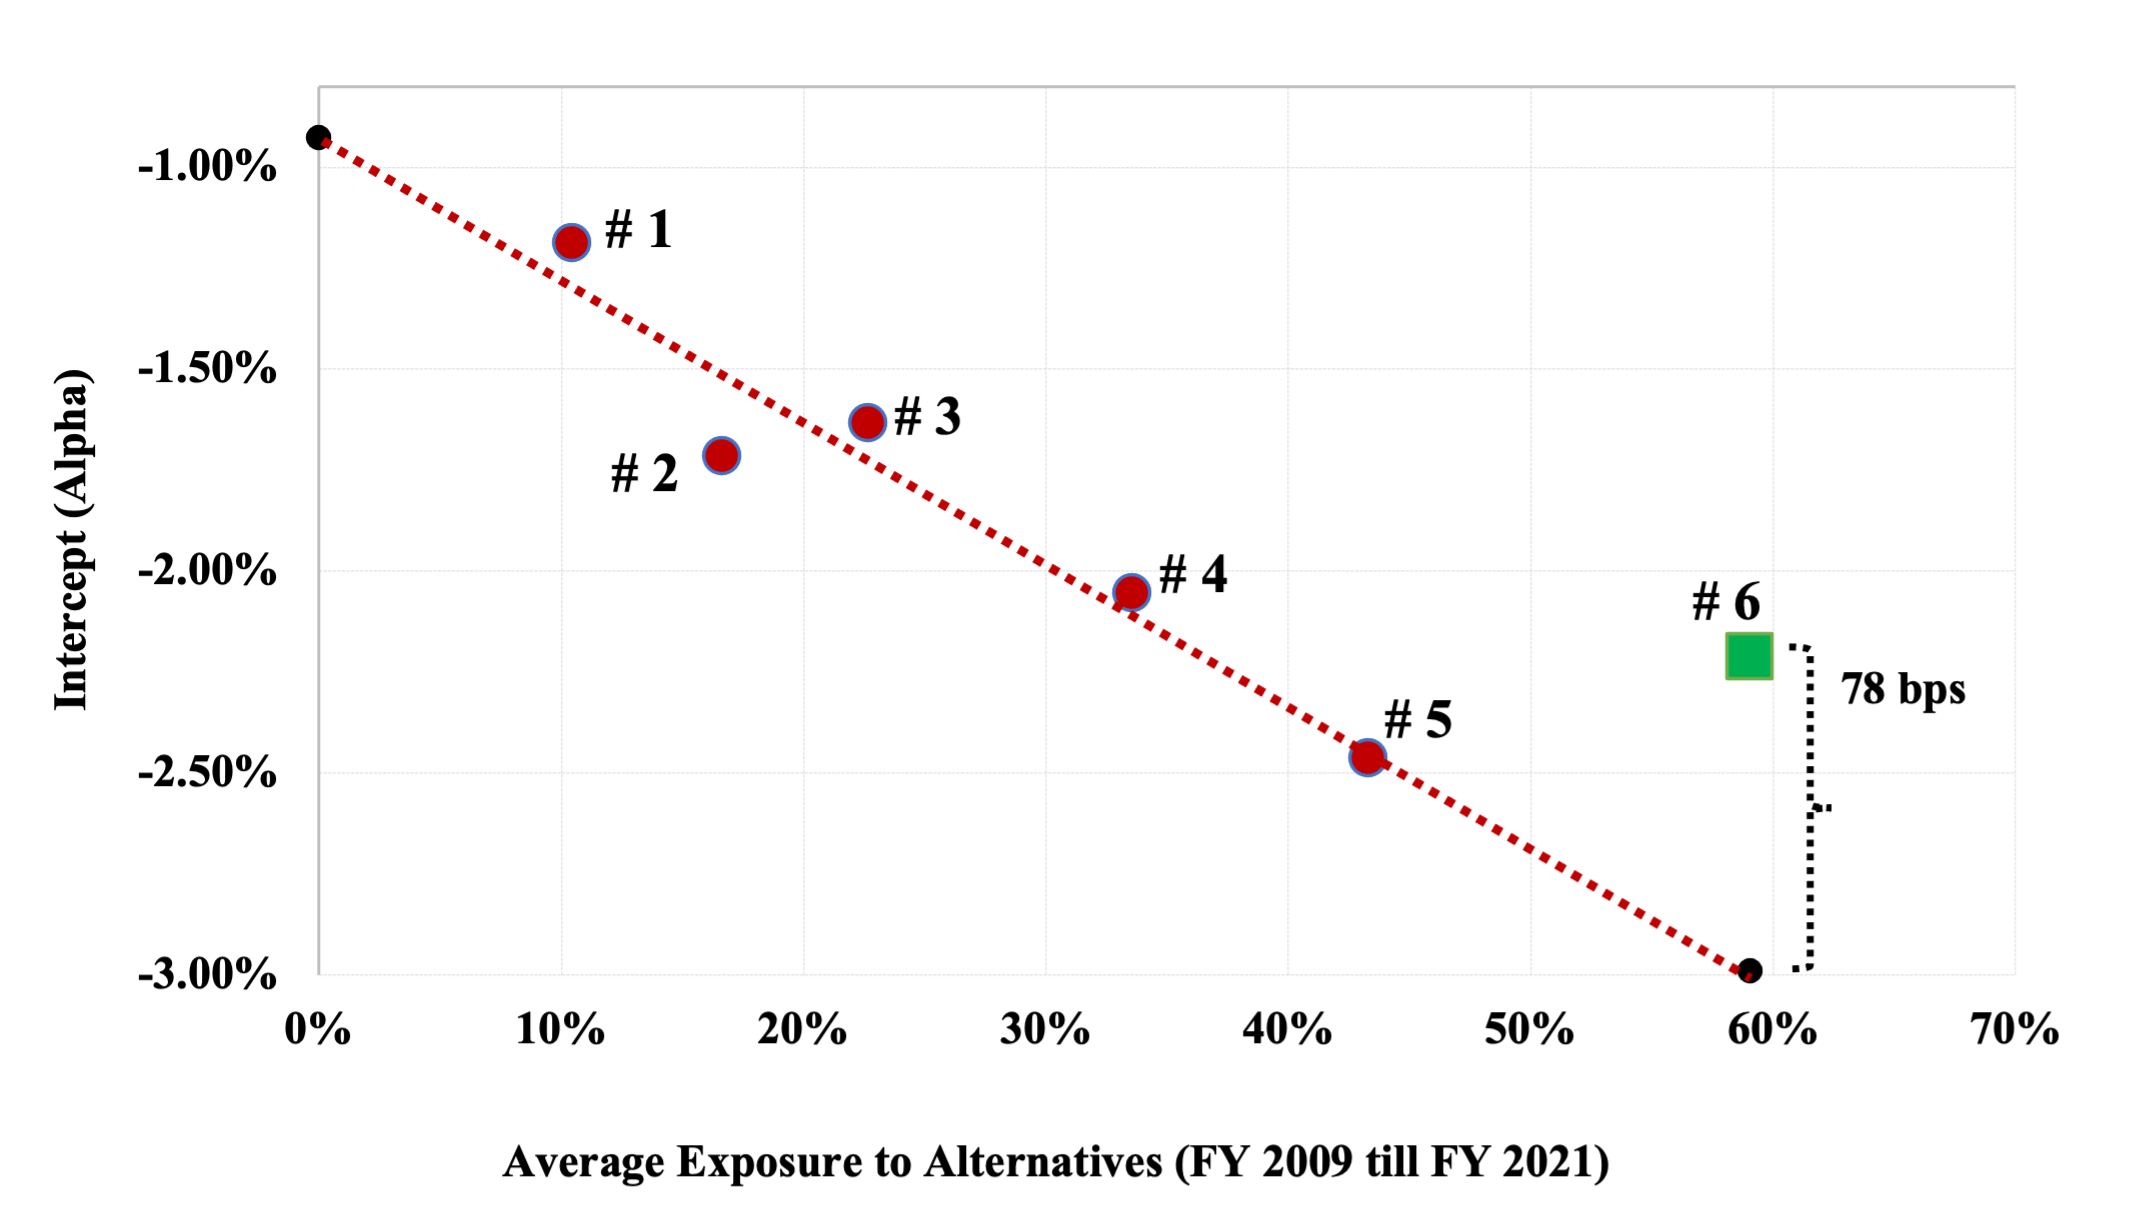
Exhibit 6 highlights an interesting twist. It is the same as Exhibit 5 except that the regression line in Exhibit 6 runs through just the first five cohort plot points, ignoring Cohort 6. A much tighter statistical fit is evident when #6 is excluded. (R2 is 93% compared with 74%. Tracking error is half as large as previously indicated, a mere 15 bps. The zero-alts intercept coefficient is -0.93% with a t-statistic of -6.0. This, by the way, is an indication of the alpha of endowments’ stock-and bond-only investments.) The slope coefficient of alpha, -3.5 bps per percentage point increase in alts exposure (with an extraordinary t-statistic of -6.0.), is much greater than shown in Exhibit 5, indicating greater sensitivity of alpha to alts exposure among the smaller endowments. Cohort 6 plots above the new regression line by 78 bps, which is more than five standard errors from it, suggesting it is an outlier vis-a-vis smaller ones. Now—to be sure—I am not saying that the largest endowments are producing positive alphas. No, like the others, their alphas are significantly negative (t-statistic of -2.8, per Exhibit 2). But it appears that endowments with assets greater than $1 billion may have an edge over their smaller peers in that they perform better than their heavy alts exposure would suggest. That is, viewed from this perspective, they lose less on their alt-investing than might be expected.
Exhibit 6
Are Large Endowments Outliers? (Yes—of a sort.)
Generally speaking, schools with assets in excess of $1 billion have a CIO-cum-investment office. This is one reason that the larger endowments invest more heavily in labor-intensive alts: They have the requisite resources to do so. Smaller schools typically have an investment committee of the board of trustees, working with a consultant, that oversees the endowment. Call it the committee-plus-consultant model. It is much less conducive to making labor-intensive investments. Let us assume for the sake of discussion that endowments constituting the largest cohort are managed by a CIO and investment office, while the rest use some version of the committee-plus-consultant model. Assume further that investment offices are better at selecting winning alternative investments than committees assisted by a consultant. Or that they have long-standing relationships with the most skillful managers, which afford them privileged access to new opportunities. Or that they are more effective in negotiating their terms of investment—and costs, in particular. Any of these characterizations of the investment office would be consistent with what we observe in Exhibit 6–namely, the largest funds, with their investment offices, exhibiting a net-of-cost competitive advantage over the others when it comes to alt investing. On the other hand, of course, the apparent edge may be simply due to chance, although the likelihood of that is slim.
There may be a parallel here with the experience of Daily Fantasy Sports (DFS) gamblers. Over time, the great majority of DFS players are losers, especially the smaller ones, who lose half of what they bet. Large gamblers—the whales, as they are sometimes known, and who are many fewer in number than the retail crowd—fall into two categories. A sliver of them are fairly consistent winners. The balance are losers. But the loser whales lose less than the little guys. That is, there is evidence of skill on the part of these whales—just not enough for them to come out ahead.[7] Exercising skill in this fashion—whether it be a university staffing up to invest in alts or a near-great gambler placing their bets—would seem to have to it a pyrrhic quality.[8] It may represent the exercise of skill, yes—but at a cost that exceeds the benefit?
SUMMARY
For more than two decades, so-called alternatives—hedge funds, private-market real estate, venture capital, leveraged buyouts, private energy, infrastructure, and private debt—have been the principal focus of institutional investors. Such investments now constitute an average of 60% of the assets of large endowments and 30% of public pension funds. Back in the 1980s, prior to the plunge into alternatives, the primary concern of institutional investment managers was the prospect of their assets being vacuumed-up up by a handful of index fund managers. Alts proved to be their salvation; for several years prior to the GFC, there was a payoff to alt investing. But the combination of (1) greater efficiency in those markets and (2) extraordinarily (and persistently) high cost has made wholesale investing in alts a losing proposition.
This paper describes two simple experiments, both of which use a large sample of high-quality data. One experiment estimates endowments’ alpha. The other pinpoints its source. Both experiments exhibit extraordinary statistical power. The key finding is that endowments—across the board—have underperformed passive investment alternatives by economically wide margins since the GFC, with pricey alternative investments almost certainly being the principal culprit in accounting for the poor showing.
We observe that large endowments have recorded greater returns than smaller ones because they take greater risk (have a greater equity exposure), not as a result of their alt investing. In fact, their greater returns have occurred in spite oftheir heavier weighting of alt investments.
Alt-investing has not been a source of diversification of stock market risk. Using conventional portfolio diversification analysis methodology, alts simply blend in with stocks and bonds statistically in explaining risk-return characteristics of endowments.
High cost is a key feature of alt investments. I estimate that institutional investors pay approximately 10 times as much for their alts as they do for traditional stock-bond strategies. With diversified bundles of alts costing that much, andbehaving not much differently than stocks and bonds in terms of their risk-return signature, there is every reason to believe that the high cost of alt-investing is a prime source of underperformance for endowments.
Large endowments appear to exhibit some skill compared with smaller ones in their execution of alt investing. Whatever such skill might exist, however, has not been enough for them to achieve a positive alpha. An ironic conclusion here is that, despite exhibiting some skill with alts, large endowments would have been better off leaving them alone altogether.
Ennis (2023b) reported on similar analysis of public-worker pension funds. Like this study, it showed that, in the aggregate, alts have had a significantly adverse effect on alpha since the GFC. Furthermore, it showed that the impact of private equity on alpha was approximately neutral, while private-market real estate and hedge funds were sources of significant underperformance. A worthy goal of future research would be to shed light on the impact of such subcategories of alternative investments on the performance of endowments.
ACKNOWLEDGMENTS
I appreciate the helpful comments of Anonymous, Joseph Bohrer, Brian Bruce, Antti Ilmanen, Eric Johnson, Christopher Philips, Nicolas Rabener and William Sharpe.
REFERENCES
Ennis, R.M. 2020. “Institutional Investment Strategy and Manager Choice: A Critique.” Journal of Portfolio Management (Fund Manager Selection Issue): 104-117.
——. 2021a. “Endowment Performance.” Journal of Investing, 30 (3) 6-20.
——. 2022. “The Fairy Tale of Alternative Investing.” The Journal of Investing, 30th Anniversary Special Issue, 31 (4) 11-16.
——. 2023a. “Excellence Gone Missing.” Journal of Investing (forthcoming). See also https://ssrn.com/abstract=4446996.
——-. 2023b. “Have Alternative Investments Helped or Hurt?” Forthcoming in The Journal of Investing. Available at SSRN: https://papers.ssrn.com/sol3/papers.cfm?abstract_id=4531038.
McKinsey & Company. 2015. “For Daily Fantasy-Sports Operators, the Curse of Too Much Skill,” September 1. See https://www.mckinsey.com/industries/technology-media-and-telecommunications/our-insights/for-daily-fantasy-sports-operators-the-curse-of-too-much-skill.
National Association of College and University Business Officers (NACUBO). 2019. “Study of Endowments.”
Plutarch. 75 C.E. “Pyrrhus.” The Parallel Lives of Plutarch. The Loeb Classical Library Edition,Vol. IX (1920).
Sharpe, W. F. 1988. “Determining a Fund’s Effective Asset Mix.” Investment Management Review 2 (6): 16–29.
——. 1992. “Asset Allocation: Management Style and Performance Measurement.” The Journal of Portfolio Management 18 (2): 7–19.
[1] NACUBO currently maintains data series for seven size cohorts. In order to establish return series for the 13-year period, however, it was necessary to consolidate two mid-range cohorts.
[2] The market indexes include ones for total US stocks, total non-US stocks (hedged and unhedged) and US investment-grade bonds.
[3] You can think of RBSA via quadratic programming as if it were multiple regression with two constraints: (1) that all the weights are non-negative and (2) that they sum to 1.0.
[4] The power of the regressions is in part owing to the fact that each cohort includes a large number of independent returns series. In gauging sample size, one must not overlook the fact that the cohorts include 73-284 individual, independently managed funds.
[5] See Ennis (2021a).
[6] Endowment managers might object to the omission of fiscal year 2022 in the present analysis. Inclusion of that year’s return would have had a decidedly favorable impact on results. In this analysis, however, I chose to take into account the fact that stock and bond markets turned sharply lower shortly before the end of fiscal year 2022, with no time for marks-to-market to take effect in the year-ending valuation of illiquid investments. Owing to stale pricing at June 30, 2022, I estimate that the typical large endowment, with its 60% allocation to alts, was overvalued by at least ten percentage points vis-a-vis the market at year-end. Endowment managers are entitled to enjoy this serendipity in their reporting for a couple of years until the market catches up with them. But factoring stale pricing into a clinical examination of performance makes no sense.
[7] See McKinsey & Company (2015) https://www.mckinsey.com/industries/technology-media-and-telecommunications/our-insights/for-daily-fantasy-sports-operators-the-curse-of-too-much-skill.
[8] History buffs: Pyrrhus of Epirus is considered by many historians second only to Alexander the Great among the triumphant generals of that ancient era. In the Battle of Asculum, the Romans lost 6,000 men and Pyrrhus 3,500, including many officers. According to Plutarch, Pyrrhus famously said of his victory at Asculum, “If we are victorious in one more battle with the Romans, we shall be utterly ruined." (Plutarch, 75.)

