Have Alternative Investments Helped or Hurt?
Institutional investors in the US hold roughly $2 trillion in alternative investments. These include private equity, private market real estate, hedge funds and other assets apart from stocks and bonds. Alternative investments, or “alts,” constitute approximately 30% of the assets of public worker pension funds and 60% of those of large endowments. Alts had an exceptional run in the years leading up to the Global Financial Crisis of 2008 (GFC), and much has been written about them over the last two decades as a result. Despite the interest, there is a paucity of research into whether or not alt-investing has improved the performance of institutional investment portfolios. Why? One reason is that it is very difficult to get good returns data for these broadly diversified funds.[1] Consequently, we do not have a clear understanding of how institutional funds have performed or which factors have helped or hurt. This paper attempts to shed light on the matter. There are two parts to the paper. In the first, I estimate the alpha of a large sample of US public pension funds. In the second, I use a novel approach to examine how alternative investing affects pension fund alpha.
PART ONE: ESTIMATING VALUE ADDED OF PUBLIC PENSION FUNDS
The study uses US public-sector pension fund data for the post-GFC era. I begin by collecting rate of return data from the annual reports of 59 large public pension funds in the US.[2] These funds only report annual returns. They use various fiscal year-ends in their reporting, which precludes making certain types of comparisons among the funds. I restrict my dataset to funds with a June 30 fiscal yearend, which is the most commonly used. I exclude a not insignificant number of funds that do not explicitly state that rates of return are net of all external investment expenses. The study spans the 13 fiscal years ended June 30, 2021.
I calculate an alpha for a 59-fund composite and the 59 individual funds. I use returns-based style analysis (RBSA) to create passively investable benchmarks.[3] The methodology statistically fits the returns of various stock and bond indexes to the return pattern of a particular institutional portfolio (or composite of them) using quadratic programming (Sharpe 1988, 1992). It results in a hybrid market index (with static proportions through time) that explains the performance of the subject return series as well as or better than any other combination of market indexes.[4] Then, I compare the subject return series to that of the RBSA index to estimate value-added over passive investment. These are the “alphas” I refer to throughout the paper.
Exhibit 1 illustrates the simple regression of an equal-weighted composite of public funds on the returns of its RBSA benchmark, as discussed above. The latter comprises index returns for Russell 3000 stocks, MSCI ACWI ex-US stocks (hedged and unhedged), and Bloomberg US Aggregate bonds. Exhibit 1 shows that RBSA can be a powerful technique in identifying the underlying market exposures of an otherwise unidentified return series. The R2 of the regression equation is 99.3%, and tracking error is just 1.0%. The intercept of the regression, the composite’s annualized alpha, is -1.24%. The t-statistic of alpha is -3.4, indicating statistical significance. The effective stock market exposure over the period is 72%.[5] Exhibit 1 demonstrates that the composite of public funds has underperformed a passive-investment benchmark by a significant margin since the GFC.
Exhibit 1
Regression of Composite Returns on Stock-Bond Benchmark
(13 years ending June 30, 2021)
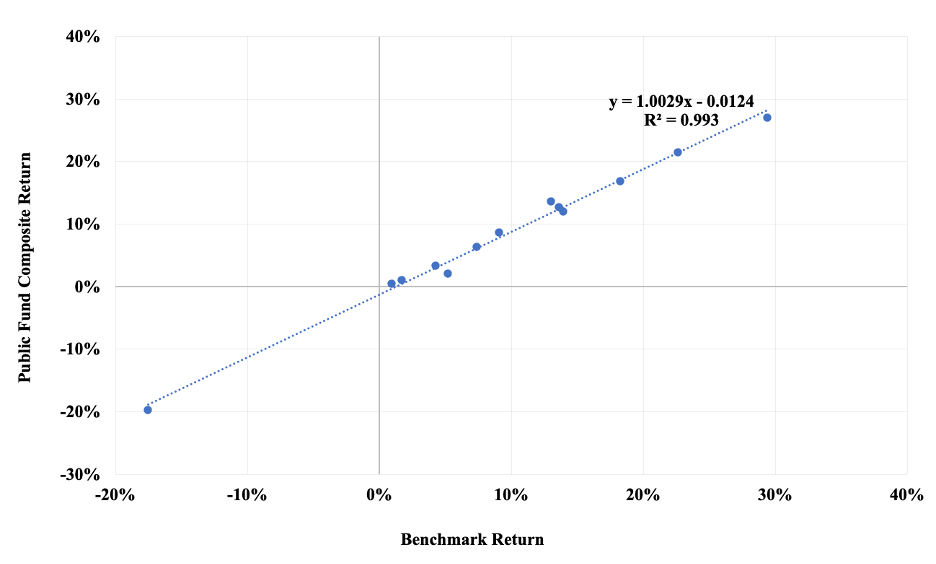
In addition to revealing the underperformance of the composite, Exhibit 1 demonstrates the absence of a diversification benefit from alts. Stock and bond indexes alone capture the return-variability characteristics of alternative investments in the public fund composite for all intents and purposes in the post-GFC era. This runs counter to the view held in some quarters that alts are good diversifiers by virtue of being uncorrelated with stocks and bonds. In fact, alts are highly correlated with US stocks, in particular.
I perform the analysis described above for each of the 59 individual funds in the dataset over the same 13-year period. This produces a unique benchmark for each fund and enables me to determine the alpha of each. The median R2 among the 59 funds is 97.9% with median tracking error of 1.7%. This indicates a typically strong statistical fit at the individual fund level, reflecting extensive diversification there. The median alpha is -1.24% (the same as for the composite). The range of alpha spans approximately six percentage points, from -3.91% to +2.00%. One positive fund alpha (2% of the total) is statistically significant, while 34 negative ones (57%) are significant. This cross-sectional analysis offers a slightly different perspective on the problem faced by institutional investors trying to outperform passive investment benchmarks: Very few have done so.
PART TWO: HOW ALT INVESTING AFFECTS ALPHA
I use no explicit returns for alternative assets in this study. Public pension funds do not report them in any sort of standardized or comprehensive way, and they are not otherwise available. Alts’ returns, however, are embedded in the pension fund returns themselves. And once stock-and-bond effects are filtered from the pension fund returns via RBSA, the alts’ non-market-return essences flow through to form the alphas we observe. In other words, the alphas described in the preceding paragraph capture the residual effects of alts, once stock-and-bond influences are removed. In what follows, I take a novel approach in examining how alt investing influences pension fund alphas, one that does not depend on the availability of alt return series themselves. To do this, I obtain data regarding public funds’ asset allocation percentages—their exposures, if you will—to various categories of alts. I then analyze how the magnitude of the funds’ alphas is affected by a small change in the exposure to various categories of alts. The analysis reveals how, at the margin, pension fund alpha varies with the substitution of alts for stocks and bonds.[6]
The Center for Retirement Research (CRR) at Boston College does an excellent job of compiling asset class allocation data for public funds and making it available at Public Plans Data (PPD).[7] For each fund, I collect annual allocation percentages for four categories of alts: (1) alts in the aggregate, (2) private equity, (3) real estate and (4) hedge funds.[8] I then calculate the 13-year-average value for each category of alts for each fund. For example, the average allocation to alts in the aggregate over the study period is 24.7%. The averages for private equity, real estate, and hedge funds are 7.3%, 7.1% and 6.2%, respectively.[9] In the analysis that follows, pension fund alpha, decoupled from beta, becomes the dependent variable. The funds’ alts’ exposures are the independent variables. I use regression analysis, simple and multiple, to evaluate the sensitivity of alpha to variation in values of the independent variables.
Alts in the Aggregate
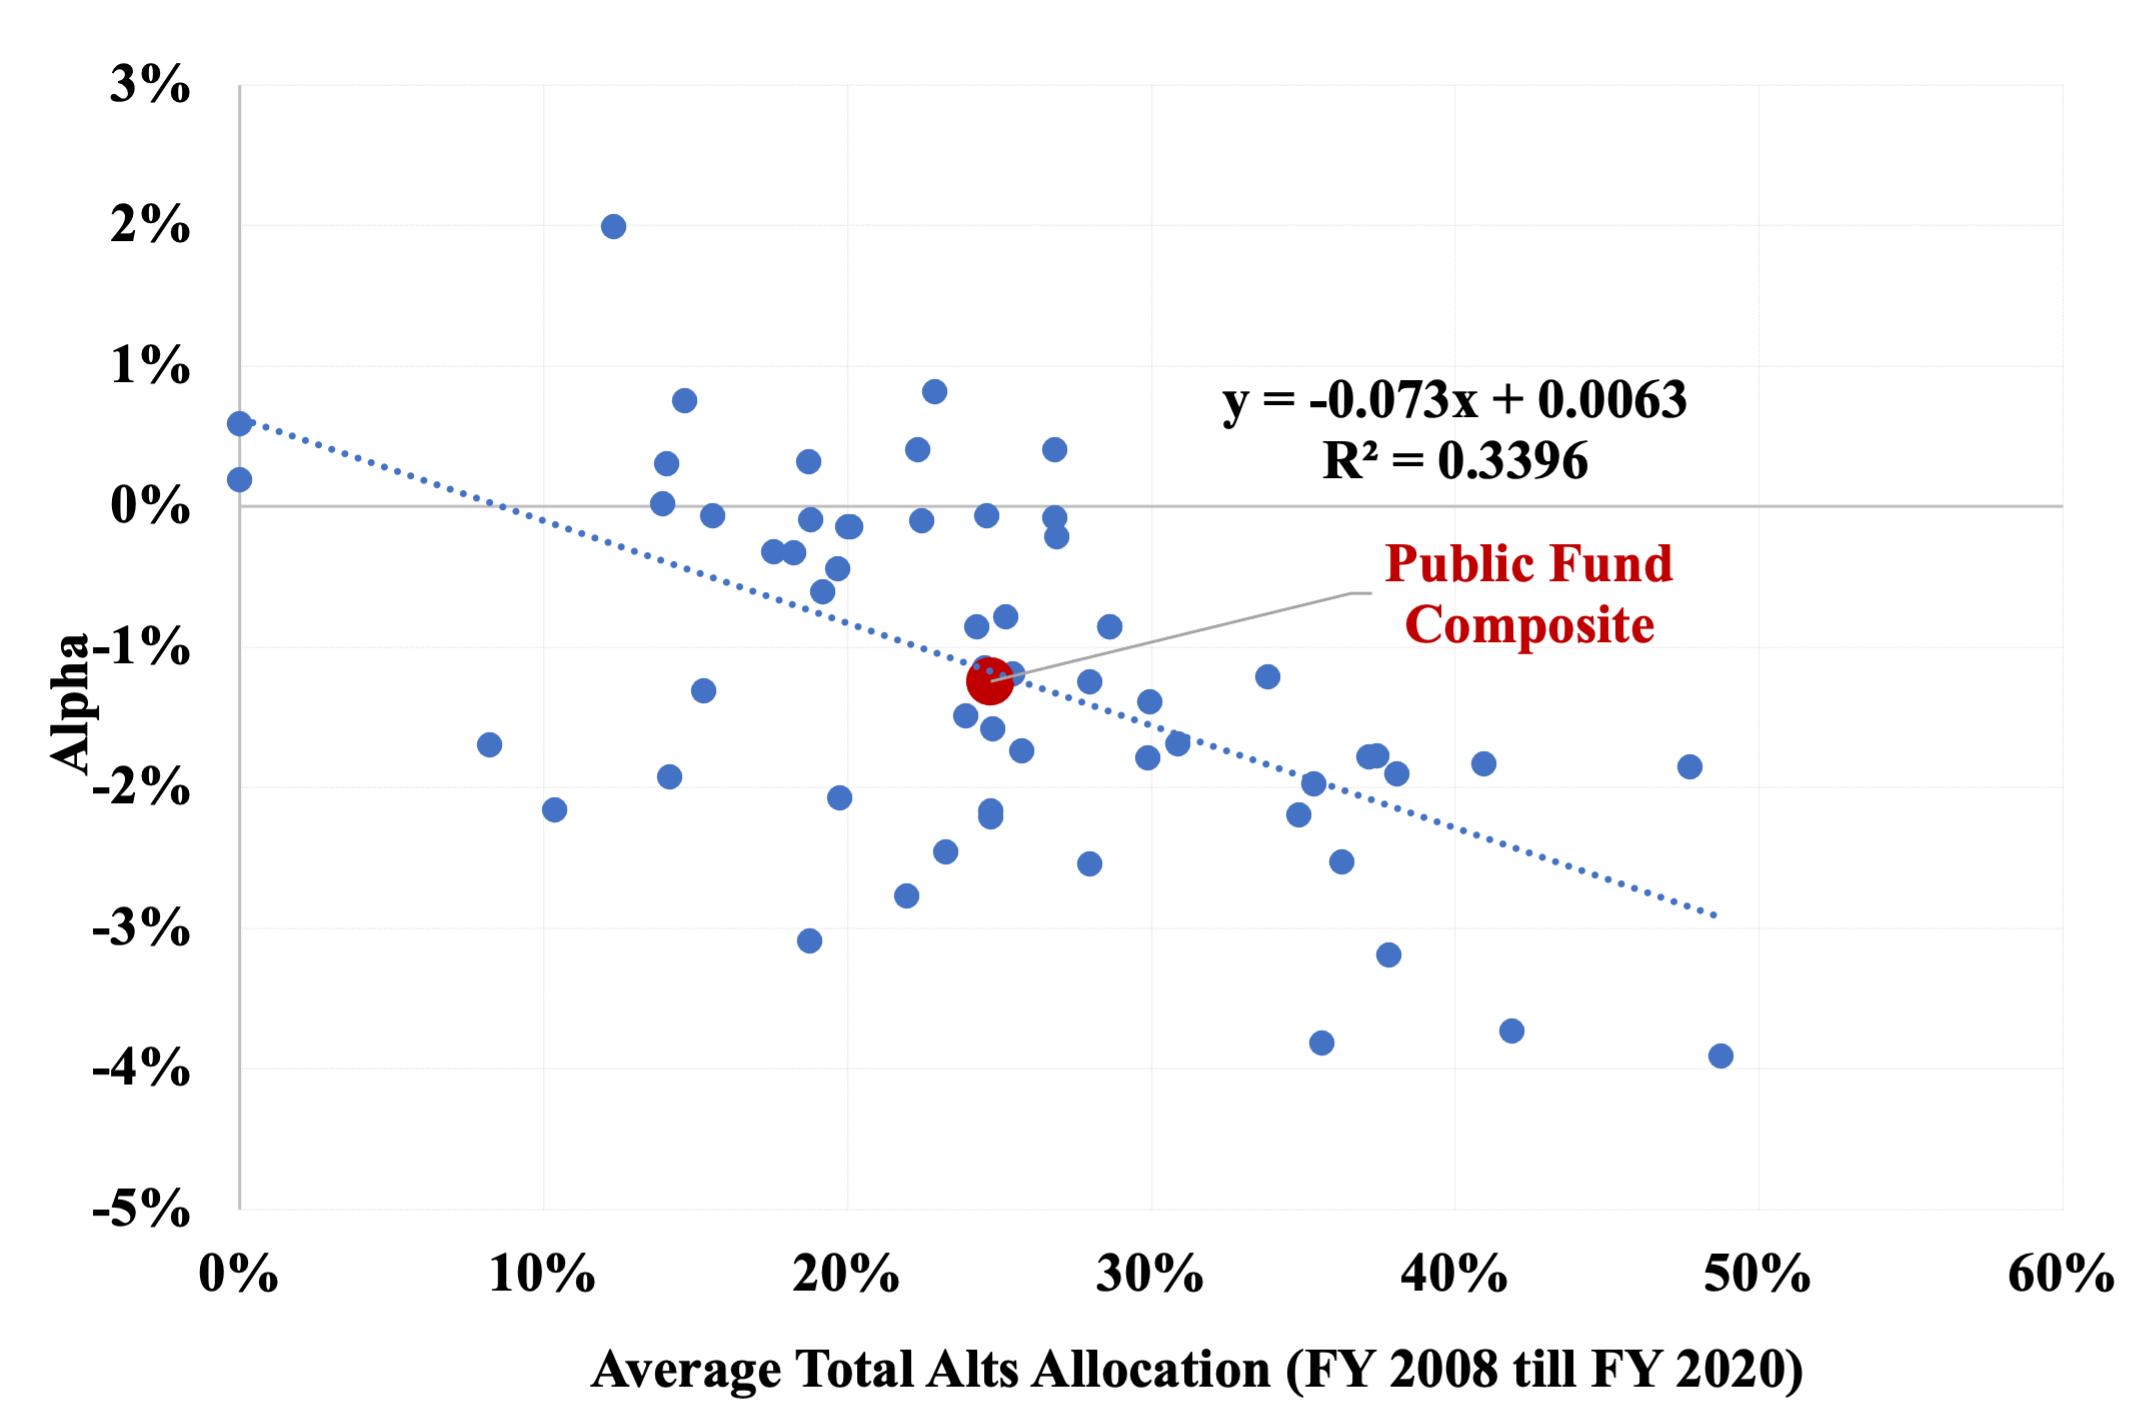
First, I regress the 59 funds’ alphas on their aggregate exposure to alts. In Exhibit 2 we observe that increases in the aggregate exposure to alts has an adverse impact on total fund alpha. Which is to say, substituting aggregate alts for stocks and bonds has the effect of reducing alpha. The R2 of the regression is 34%. In other words, 34% of alpha variance is associated wit the variance of the aggregate alts exposure. The regression intercept, which corresponds to zero alts, is +0.63%. For every percentage point of assets allocated to alts in the aggregate, there is a corresponding 7.3 bps reduction in annualized total fund alpha. (With a t-statistic of -5.4, the slope coefficient is statistically significant.) For a 24.7% average allocation to alts over the time period, the annualized alpha indicated by this equation is -1.18%. This is a strong indication that pension funds’ aggregate allocation to alts has been a serious drag on performance. Also plotted in Exhibit 2 is the public fund composite, the coordinates of which are 24.7%, -1.24%.
Alpha appears to respond to the presence of alts as if the latter were kryptonite—the greater the exposure, the harsher the effect on alpha.
Exhibit 2
Relationship of Public Fund Alphas and Aggregate Allocation to Alternative Investments
(13 years ended June 30, 2021)
Sensitivity to Select Alts Exposures
In this section, I examine how principal alts subcategories have contributed to the overall alts effect. To do this, I regress the dependent variable (pension fund alpha) on three independent variables, namely, the average exposures for private equity, real estate, and hedge funds. Here I use multiple linear regression analysis.[10] Exhibit 3 contains the regression coefficients for each subcategory of alts, along with their associated t-statistics and contributions to total fund alpha. A one-percentage-point increase in the exposure to private equity, for example, is associated with a minuscule reduction in alpha of 0.2 bps. Consequently, the average exposure of 7.3% to private equity leads to just an approximate one-basis-point reduction in alpha (far right column). From this we can conclude that the funds’ private equity exposure has not been a factor one way or the other in the realization of alpha.
Exhibit 3
Contribution of Alts Subcategories to Total Fund Alpha Using Multiple Regression
(13 years ended June 30, 2021)
|
Category of Alternative Investment |
Average Allocation Over Time (%) |
Allocation Range (%) |
Marginal Contribution to Total Fund Alpha of a One-Percentage-Point Increase in the Allocation to the Subcategory (bps) |
t- Statistic |
Contribution to Total Fund Alpha (bps) |
|
Private Equity |
7.3 |
0 to 22.5 |
-0.2 |
-0.0 |
-01 |
|
Real Estate |
7.1 |
0 to 16.4 |
-9.6 |
-2.3 |
-68 |
|
Hedge Funds |
6.2 |
0 to 24.4 |
-11.0 |
-4.5 |
-69 |
|
Total |
20.6 |
0 to 48.7 |
- |
- |
-138 |
|
|
|
|
|
|
|
|
Intercept |
- |
|
- |
0.6 |
+20 |
|
Total with Intercept |
- |
|
- |
- |
-118 |
The story for real estate and hedge funds is very different. Both have statistically significant negative regression coefficients, and both account for alpha reduction of approximately 70 bps.
When the contributions to alpha are summed with the multiple regression intercept of +20 bps, the alpha indicated for public funds collectively is -118 bps.[11] This value is nearly as great as the aggregate underperformance of the public fund composite of -124 bps.[12]
It is important to appreciate that the values in the rightmost column of Exhibit 3 are not estimates of alpha for the various alts types. Inasmuch as I do not have alt returns to work with, I am unable to estimate their alphas. The values shown indicate the impact of various subcategories of alts on pension fund alpha at the alts’ average exposure level.
It is not possible to prove that alts’ exposures drive alpha. The alphas are, however, beta-free returns unique to each fund. The statistically significant regression coefficients of alpha on exposure to alts in the aggregate and for two of the three subcategories tell us that something (not reasonably attributable to chance) is occurring in the relationship between alpha and alts. The high cost of investing in alts, combined with the two-decade-long evolution of their markets, is identified in the discussion, below, as a plausible joint cause of the effect we observe.
DISCUSSION
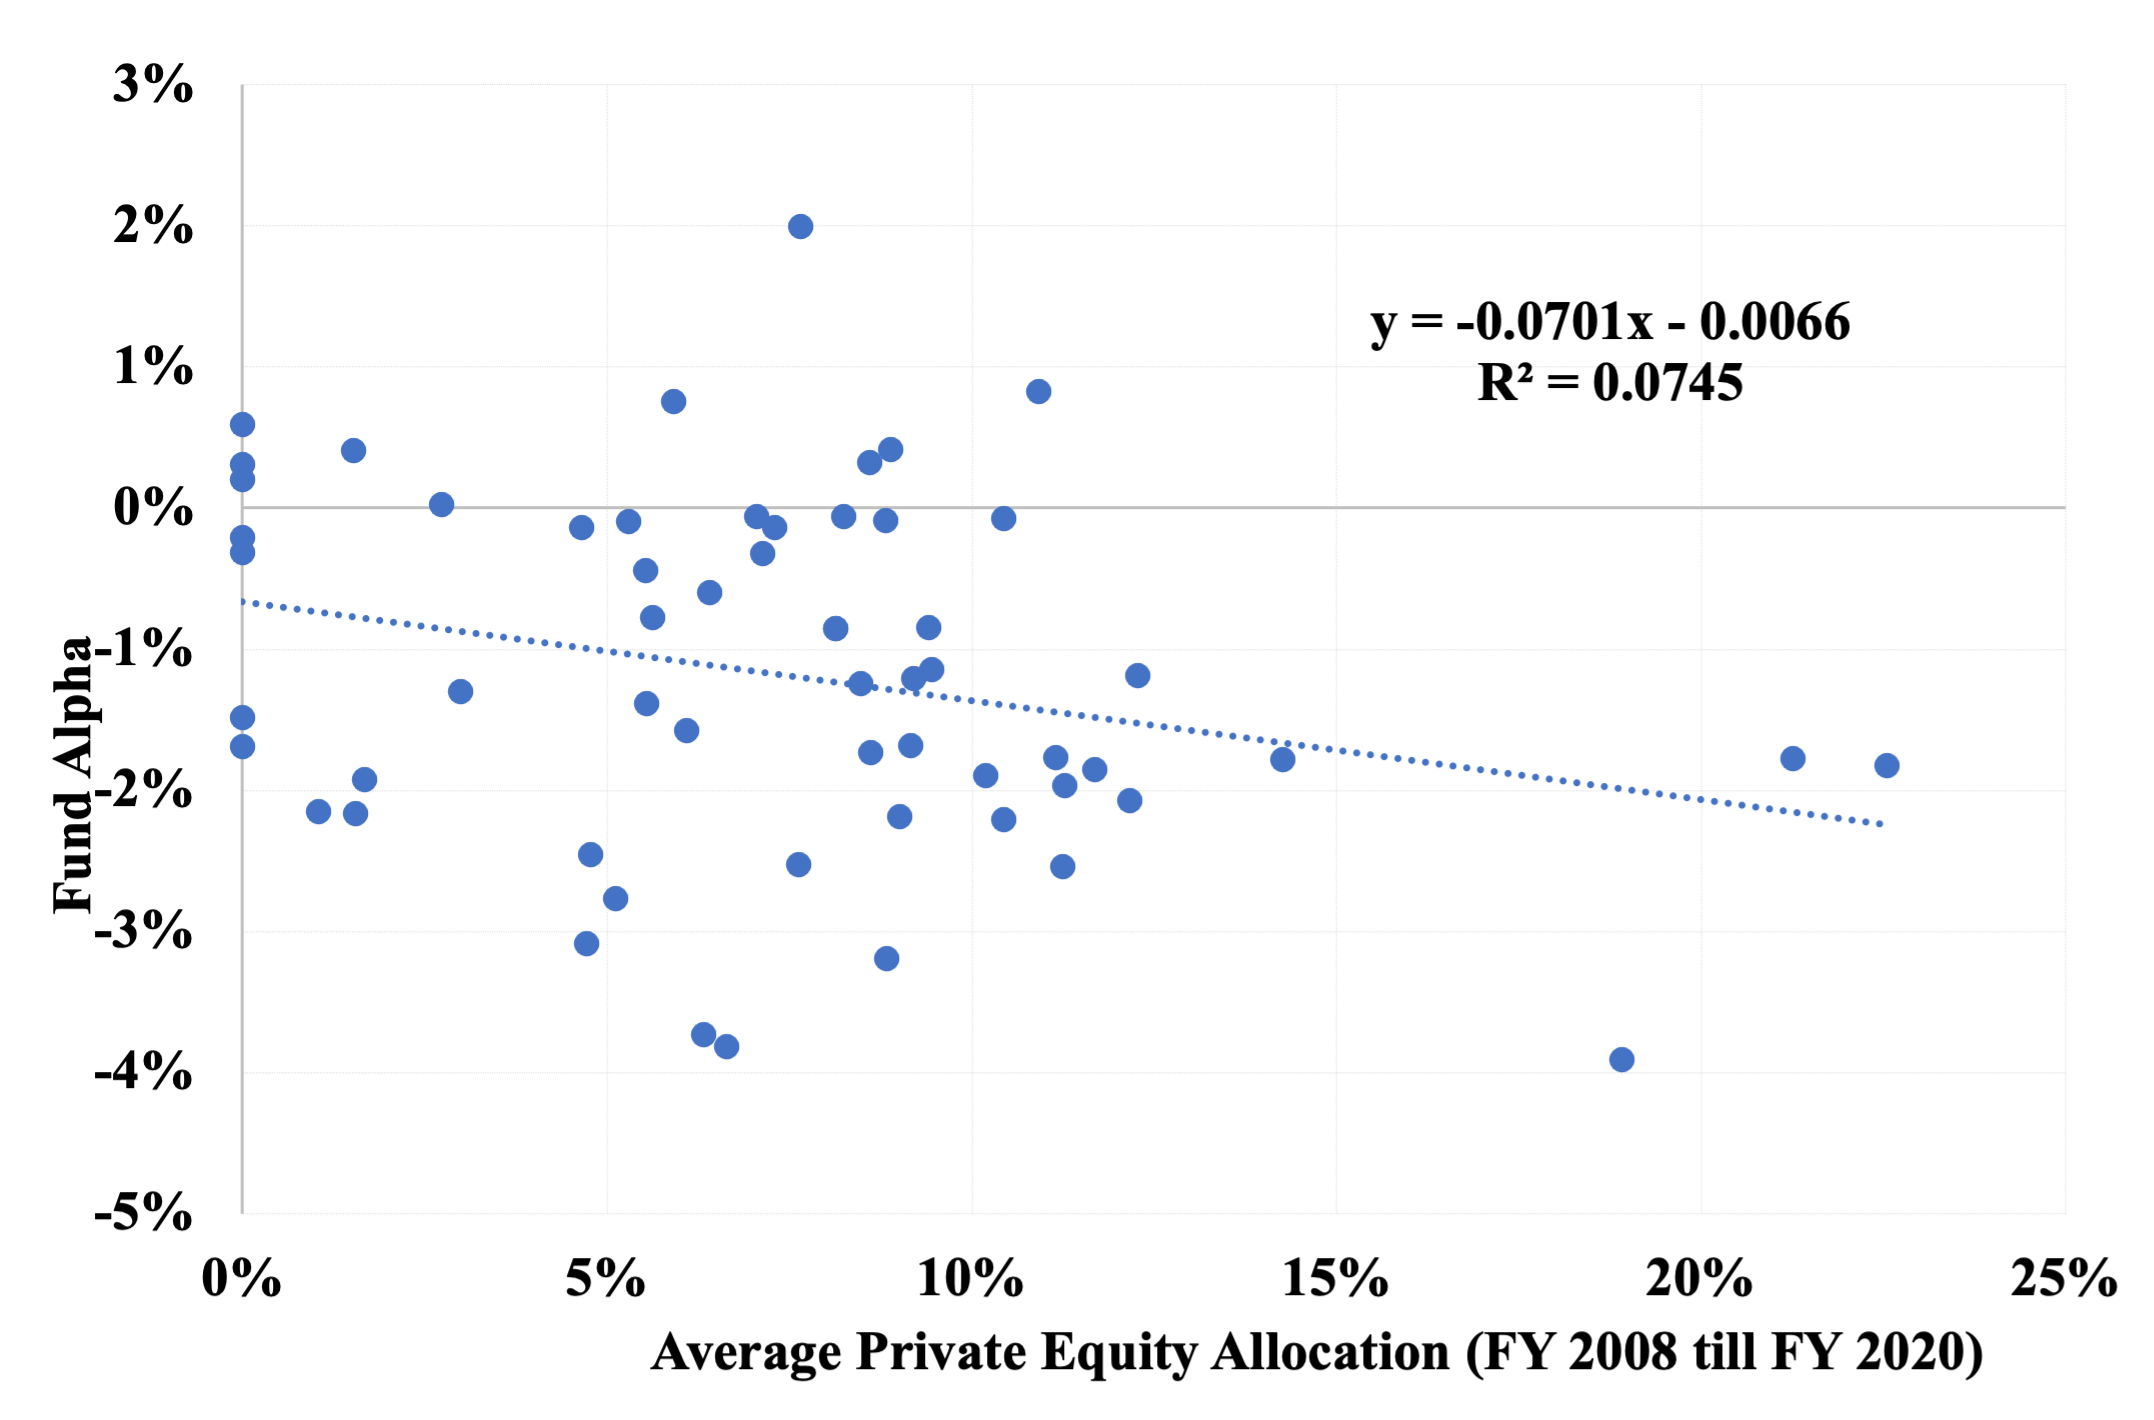
The finance literature is unresolved as to whether private equity investments have outperformed public markets. Harris et al. (2022), for example, argues that public market equivalents (PMEs)[13] for private equity indicate that private equity has outperformed the S&P 500 Index over time, before and after the GFC. On the other hand, Phalippou (2020) concludes it has been about a tie between public and private equity in terms of PMEs, post GFC; and that ignores leverage, illiquidity and benchmark selection issues that are part of the conversation. The simple natural experiment described here will not resolve the private-versus-public debate. What I can say is that I find no support for the proposition that private equity has added value to pension fund returns in the post-GFC era. To elaborate, Exhibit 4 shows the relationship between fund alpha and private equity exposure without consideration of the other independent variables.[14] The downward-slopping regression line indicates a negative relationship between alpha and private equity exposure under this interpretation. If private equity had generated returns greater than those of public equities, with similar risk, we would expect to see a regression line with a positive slope.[15] The same general relationship holds, by the way, between total return of the pension funds and private equity exposure, which is an even simpler, though cruder, experiment.[16] In short, there is no sign here that substituting private equity for public stocks would have been advantageous during the study period.
Exhibit 4
Relationship of Fund Alpha and Private Equity Exposure
(Simple linear regression)
The negative influence of real estate observed here is consistent with other research. Beath and Flynn (2022) report private market real estate significantly underperforming real estate investment trusts (REITs) between 1998 and 2020, before and after adjusting for a differential in risk. Cambridge Associates (2022) reports that private market real estate underperformed REITs by 3.23 percentage points per year for the 20 years ended 2021. Bollinger and Pagliari (2019), using Burgiss data, finds that non-core real estate investments (which account for an estimated one-half of pension funds’ real estate allocations), generated negative alphas of approximately three percentage points per year between 2000 and 2017. Andonov (2022) observes a real estate alpha of -2.94% annually between 1991 and 2017 for pension fund investors Nevertheless, for the first time to my knowledge, the results reported here place private real estate’s underperformance in the context of actual institutional investment portfolio outcomes. An average exposure of about 7% to private market real estate is associated with nearly 70 bps a year reduction in alpha for these institutional investors.
Sullivan (2021) reports a deterioration in hedge fund performance following the GFC, with hedge fund alpha declining thereafter to -1.0% a year. Bollen et al. (2021) reports that hedge funds began to significantly underperform stocks and bonds in 2011. So, once again, while hedge funds’ underperformance doesn’t come as news, we now have an indication of its impact on the returns of institutional portfolios. Pension funds’ average hedge fund exposure of about 6% reduced total fund alpha by about 70 bps per year over the study period.
I am aware of two other studies that examine the performance of alts using actual institutional investor experience. Both use data of CEM Benchmarking, a consulting firm that maintains a comprehensive commercial dataset of institutional returns. Beath and Flynn (2022) calculate the Sharpe ratio of various asset classes used by US defined benefit pension funds for the period 1998–2020.[17] See Exhibit 5. Bonds’ exceptional Sharpe ratio (0.66) reflects the extraordinary, secular downtrend in interest rates over the period, combined with the low return volatility inherent in bonds. The Sharpe ratio of private equity (0.40) is comparable to that of publicly traded equity in the US (0.41–0.43). The Sharpe ratio of private real estate materially lags those of the various US equity and REIT categories. Hedge funds are conspicuously poor performers. The CEM results, while taking a very different form, closely parallel the ones reported here in their import. Additionally, Andonov (2022), analyzing CEM data between 1991 and 2017, observes the same performance pattern reported here and by Beath and Flynn (2022). Namely, private equity investments essentially match those of publicly traded equities over the long run. Real estate underperforms by 2.94% per year and hedge funds by 4.94% per year.
Exhibit 5
Sharpe Ratios Reported by CEM Benchmarking
(1998-2020)
|
Asset Class |
Sharpe Ratio |
|
US Bonds |
0.66 |
|
Large Cap US Equity |
0.43 |
|
REITs |
0.42 |
|
Small Cap US Equity |
0.41 |
|
Private Equity |
0.40 |
|
Non-US Equity |
0.32 |
|
Private Real Estate |
0.32 |
|
Hedge Funds (and TAA) |
0.25 |
Source: Beath and Flynn (2022).
High cost must be a partial, at least, explanation, for alts’ weak showing. I estimate that alts cost institutional investors about 10 times as much as traditional stock and bond strategies. My approximate cost figures for alts, in bps annually, are 230 for private real estate (core combined 50-50 with non-core), 300 for hedge funds, 500 for private equity, and 80 for commodities. I estimate the typical public pension fund incurs costs of approximately 30 bps for traditional stock and bond strategies (active and passive combined) and roughly 300 bps for a diversified portfolio of alts. I have estimated the typical annual cost of investing public pension funds, with their current average 30-percentage-point allocation to alts, at approximately 1.2% of assets, which approximates the observed margin of underperformance described here.[18] Given the evolution of alts markets over two decades—becoming more liquid, more competitive, and better integrated with public markets than they were during alts’ heyday in the 1990s and early 2000s—it is no surprise that these costs weigh heavily on investors’ experience with alts.
This paper shows that since the GFC, US public-sector pension funds’ exposure to alternative investments is strongly associated with a reduction in alpha of approximately 1.2 percentage points per year relative to passive investment. While exposure to private equity has arguably neither helped nor hurt, both real estate and hedge fund exposures have detracted significantly from performance. Institutional investors should consider whether continuing to invest in alts warrants the time, expense and reduced liquidity associated with them.
ACKNOWLEDGMENTS
I appreciate the helpful comments of Aleksandar Andonov, Anonymous, Matthew Arnold, John Bass, Alex Beath, Keith Black, Mitchell Bollinger, Brian Bruce, Elroy Dimson, Barry Gillman, Antti Ilmanen, Eric Johnson, Steven Kaplan, Paul O’Brien, Joseph Pagliari, Ludovic Phalippou, Christopher Philips, Dan Rasmussen, Trym Riksen, Michael Sebastian, William Sharpe, Trey Shipp, and Rodney Sullivan.
REFERENCES
Andonov, A. 2022. “Delegated Investment Management in Alternative Assets.” The Review of Corporate Finance Studies, 00, 1–38.
Beath, A.D. and C. Flynn. 2022. “Asset Allocation and Fund Performance of Defined Benefit Pension Funds in the United States, 1998-2020.” CEM Benchmarking.
Bollen, N.P.B., J. Joenvaara and M. Kauppila. 2021. “Hedge Fund Performance: End of an Era?” Financial Analysts Journal, 77:3, 109-132.
Bollinger, M. A., & Pagliari, J. L. (2019). “Another Look at Private Real Estate Returns by Strategy.” Journal of Portfolio Management, 45(7), 95–112.
Cambridge Associates. 2022. “Real Estate Index and Selected Benchmark Statistics.” https://www.cambridgeassociates.com/wp-content/uploads/2022/05/WEB-2021-Q4-Real-Estate-Benchmark-Book.pdf
Center for Retirement Research at Boston College. https://publicplansdata.org/quick-facts/national/.
Ennis, R.M. 2020. “Institutional Investment Strategy and Manager Choice: A Critique.” Journal of Portfolio Management (Fund Manager Selection Issue): 104-117.
———. 2022a. “Cost, Performance, and Benchmark Bias of Public Pension Funds in the United States: An Unflattering Portrait.” Journal of Portfolio Management.
———. 2022b. “A Universal Investment Portfolio for Public Pension Funds: Making the Most of Our Herding Ways.” Journal of Investing.
Harris, R.S., T. Jenkinson, S.N. Kaplan and R. Stucke. 2022. “Has Persistence Persisted in Private Equity? Evidence from Buyout and Venture Capital Funds.” Journal of Corporate Finance (forthcoming).
Phalippou, L. 2020. “An Inconvenient Fact: Private Equity Returns & The Billionaire Factory.” University of Oxford, Said Business School, Working Paper, Available at SSRN: https://ssrn.com/abstract=3623820.
Sharpe, W. F. 1988. “Determining a Fund’s Effective Asset Mix.” Investment Management Review (September/October): 16–29.
——— . 1992. “Asset Allocation: Management Style and Performance Measurement.” Journal of Portfolio ManagementWinter: 7-19.
Sullivan, R.N. 2021. “Hedge Fund Alpha: Cycle or Sunset?” The Journal of Alternative Investing.
[1] Institutional investors in the US include endowments, foundations and other nonprofits; public worker pension funds; and multi-employer and single-employer pension funds in the private sector. The aggregate value of these institutional investment portfolios is approximately $10 trillion. Only large public pension funds publicly report rates of return with consistency (if imperfectly). A smattering of endowments do, and these tend to be the very largest ones. Endowment returns must be obtained, one by one, from the schools’ annual reports.
[2] I supplement this with data from the Center for Retirement Research at Boston College (https://publicplansdata.org/quick-facts/national/).
[3] See Ennis (2020) for a detailed discussion of the procedure.
[4] You can think of RBSA via quadratic programming as if it were multiple regression with two constraints: (1) that all the weights are non-negative and (2) that they sum to 1.0.
[5]The specific allocation is 52% Russell 3000, 13% unhedged ACWI ex-US, 7% hedged ACWI ex-US, and 28% Aggregate US bonds. Alts used by the funds are highly correlated with US stocks and bonds. Consequently, the funds’ alts holdings load nearly exclusively on the US stock and bond indexes with RBSA. The effective exposure to ACWI ex-US (20%) is similar to the reported (actual) allocation to non-US equities.
[6] This is a natural experiment. In simplest terms, a natural experiment is one in which the observer has no control over the independent variables apart from deciding which naturally occurring ones to incorporate in
the experiment. This contributes to the parsimony of the experiment. Also, it is noteworthy that in this experiment, the returns of each pension fund’s actual alt investments—not hypothetical returns from exogenous sources—are what manifest themselves in the funds’ returns and alphas.
[7] The categories of alts identified in PPD are real estate, hedge funds, private equity, commodities, and “other.” The bulk of the holdings are in the first three categories (https://publicplansdata.org/quick-facts/national/).
[8] Each public fund classifies its own investments as it sees fit. Accordingly, investment categories should be interpreted broadly.
[9] The latter percentages sum to 20.6%, which is less than 24.7% because the aggregate figure includes small allocations to other types of alts, such as commodities and private debt.
[10] Multiple regression evaluates the effect of each independent variable while holding the others constant. The multiple regression R2 is 35% and tracking error is 1.0%.
[11] That this alpha of -118 bps is identical to the one developed for alts in the aggregate (Exhibit 2), is a bit happenstance. The implicit alts exposure in the prior analysis was 24.7%. Here it is 20.6%, owing to the exclusion of small allocation to other alts, e.g., commodities. We would expect the alphas to be similar but not necessarily identical.
[12] Alts’ exposure has an adverse effect on total return of these same funds, i.e., fund return before adjusting for market exposures. The relationship isn’t as strong as it is when focusing on alpha (as theory would suggest): The negative slope coefficient for total return vs. total alts is about half as large as it is for alpha vs. total alts (-3.1 vs. -7.3). The -3.1 t-statistic for the total return slope coefficient is, however, significant. There is nothing subtle about the influence of alts on the performance of these diversified portfolios.
[13] PMEs are formed by applying the cash flows of private equity limited partners to a stock index, such as the S&P 500, to determine the accumulated value of those cash flows had a stock index fund been the source of funds for the private equity investments and the vehicle in which private equity distributions were invested. A separate PME is calculated for each vintage year of investment. PMEs are stated as ratios of hypothetical accumulated private equity value to that of the stock index investment at a particular point in time. A PME ratio greater than 1.0 indicates greater earnings for private equity.
[14] In order to isolate the effect of individual independent variables on the dependent variable, multiple regression holds the other independent variables constant in the analysis of each independent variable.
[15] Intercept and slope coefficients in Exhibit 4 are statistically significant. The t-statistics are -2.3 for the intercept and -2.1 for the slope.
[16] The slope coefficient for the regression of total return on private equity exposure, although negative, is not significant (t-statistic of -0.9).
[17] See Beath and Flynn (2022).
[18] See Ennis (2022a) for cost details.

