Unexceptional Endowment Performance
Conventional wisdom has it that the investment offices of leading universities are exceptional in the realm of institutional investing. Siegel (2021), for example, provides a fulsome account of what he sees as their competitive advantages. He concludes, “Endowment funds have...structural advantages...that should allow them to earn above-market risk-adjusted returns in the long run.” Hmm. Is endowment exceptionalism real? Is it myth? A little of both?
Here I examine the performance of a sample of 41 large US endowments[1] over the 15 fiscal years, 2009-2023.[2] First, I analyze a composite (equal-weighted average) of their returns, and then I analyze individual fund returns. In both cases, I create customized benchmarks using quadratic programming, a technique that statistically fits broad market indexes to the subject return series to form a hybrid index. The market indexes are Russell 3000 stocks, MSCI ACWI ex-US stocks (hedged) and Bloomberg Barclays US Aggregate bonds. The resulting benchmark weights for the composite are 61%, 22% and 17%, respectively. No combination of broad market indexes has a better statistical fit with the subject return series.
Exhibit 1 compares composite returns and those of the benchmark.[3] The difference between the two is excess return. Annualized excess return is -0.9% for the 15 years. For the first 12 years, excess return averages about -1.7% per year within a narrow range. The 2021 return reflects a sharp gain for venture capital, which didn’t last long. The composite returns of 2022 and 2023 exhibit return smoothing caused by lags in reporting net asset values of private assets. Notwithstanding the return smoothing, which muddies the waters in the latter years, the composite registered a cumulative loss relative to benchmark of 13% for the study period and underperformance in 12 of 15 years.[4]
Exhibit 1
Excess Return of Endowment Composite
|
Fiscal Year |
Composite Return |
Benchmark Return |
Excess Return |
|
2009 |
-20.7% |
-20.1 |
-0.6 |
|
2010 |
11.8 |
13.8 |
-2.0 |
|
2011 |
20.2 |
23.4 |
-3.2 |
|
2012 |
1.5 |
1.7 |
-0.2 |
|
2013 |
12.0 |
16.8 |
-4.8 |
|
2014 |
17.3 |
19.8 |
-2.5 |
|
2015 |
6.2 |
6.6 |
-0.5 |
|
2016 |
-1.6 |
0.3 |
-1.9 |
|
2017 |
13.2 |
16.0 |
-2.8 |
|
2018 |
10.9 |
10.8 |
0.1 |
|
2019 |
6.5 |
7.7 |
-1.2 |
|
2020 |
4.0 |
5.2 |
-1.2 |
|
2021 |
42.4 |
33.4 |
9.0 |
|
2022 |
-4.3 |
-12.5 |
8.2 |
|
2023 |
3.7 |
14.7 |
-10.9 |
|
Annualized |
7.4% |
8.3% |
-0.9% |
Next, I analyzed the returns of the 41 individual endowments making up the composite. I used the same methodology as with the composite. Accordingly, each endowment has a unique benchmark, with its own blend of matching market indexes. Summary results are shown in Exhibit 2.[5] The effective equity allocations pertain to the respective benchmarks and range from 69% (Missouri) to 97% (Duke). Three of the schools have a positive excess return of 1% or more, but just barely. Nearly half of them underperform by a percentage point or more and several by two percentage points or more. Investment offices once widely considered to be elite, e.g., those of Duke, Harvard, Notre Dame, Princeton, Stanford and Yale, are not in the top quartile over the past 15 years. On the other hand, investment offices of lesser note, such as those of Michigan State, Missouri, Rice, Tulane and the University of California do occupy top-quartile berths.
Exhibit 2
Excess Return, 15 years 2009-2023
|
Perf. Rank |
School |
Excess Return (%) |
Effective Equity Allocation (%) |
|
1 |
University of Missouri |
1.3 |
69 |
|
2 |
Michigan State University |
1.2 |
83 |
|
3 |
University of Pennsylvania |
1.1 |
79 |
|
4 |
Columbia University |
0.6 |
70 |
|
5 |
Bowdoin College |
0.4 |
90 |
|
6 |
Massachusetts Institute of Technology |
0.4 |
81 |
|
7 |
University of California |
0.3 |
79 |
|
8 |
Rice University |
0.2 |
77 |
|
9 |
Tulane University |
0.2 |
85 |
|
10 |
Dartmouth College |
0.0 |
81 |
|
11 |
Purdue University |
0.0 |
80 |
|
12 |
University of Michigan |
-0.1 |
84 |
|
13 |
Pennsylvania State University |
-0.1 |
74 |
|
14 |
North Carolina State University |
-0.1 |
80 |
|
15 |
Princeton University |
-0.3 |
85 |
|
16 |
Yale University |
-0.4 |
79 |
|
17 |
Williams College |
-0.6 |
87 |
|
18 |
Ohio State University |
-0.7 |
80 |
|
19 |
Brown University |
-0.8 |
87 |
|
20 |
Northwestern University |
-0.8 |
70 |
|
21 |
University of North Carolina at Chapel Hill |
-0.9 |
85 |
|
22 |
University of Virginia |
-0.9 |
85 |
|
23 |
Wellesley College |
-1.0 |
82 |
|
24 |
Rutgers University |
-1.0 |
73 |
|
25 |
Stanford University |
-1.1 |
83 |
|
26 |
University of Washington |
-1.1 |
83 |
|
27 |
University of Richmond |
-1.2 |
83 |
|
28 |
University of Notre Dame |
-1.2 |
87 |
|
29 |
Case Western University |
-1.4 |
76 |
|
30 |
UCLA Foundation |
-1.4 |
86 |
|
31 |
University of Rochester |
-1.6 |
83 |
|
32 |
Amherst College |
-1.6 |
91 |
|
33 |
University of Southern California |
-1.8 |
90 |
|
34 |
Carnegie Mellon University |
-2.0 |
87 |
|
35 |
Duke University |
-2.0 |
97 |
|
36 |
Vanderbilt University |
-2.0 |
87 |
|
37 |
University of Georgia |
-2.1 |
85 |
|
38 |
Cornell University |
-2.2 |
88 |
|
39 |
University of Chicago |
-2.2 |
72 |
|
40 |
Harvard University |
-2.5 |
78 |
|
41 |
Washington University in St. Louis |
-2.7 |
94 |
|
- |
Composite |
-0.9% |
83% |
Exhibit 3 reports an alternative measure of performance merit. It ranks schools by Sharpe ratio (risk premiumdivided by standard deviation). The rank order differs somewhat from that shown in Exhibit 2, but there is a high degree of correlation between the two. Here, the top three performers are Penn, Rice and Columbia.
Exhibit 3
Sharpe Ratios
|
Rank |
School |
Sharpe Ratio |
Total Return (%) |
Standard Deviation (%) |
|
1 |
University of Pennsylvania |
0.604 |
8.3 |
12.6 |
|
2 |
Rice University |
0.582 |
7.8 |
12.3 |
|
3 |
Columbia University |
0.579 |
7.6 |
12.0 |
|
- |
62-21-17 Benchmark |
0.569 |
8.3 |
13.5 |
|
4 |
Pennsylvania State University |
0.564 |
7.8 |
12.6 |
|
5 |
Northwestern University |
0.563 |
7.3 |
11.8 |
|
6 |
Yale University |
0.560 |
8.3 |
13.7 |
|
7 |
Massachusetts Institute of Technology |
0.552 |
9.4 |
15.8 |
|
8 |
Dartmouth College |
0.549 |
8.4 |
14.1 |
|
9 |
Bowdoin College |
0.544 |
9.7 |
16.6 |
|
10 |
University of California |
0.543 |
7.4 |
12.4 |
|
11 |
University of Missouri |
0.532 |
6.6 |
11.2 |
|
12 |
Princeton University |
0.521 |
8.6 |
15.1 |
|
13 |
University of Virginia |
0.515 |
8.6 |
15.3 |
|
14 |
Michigan State University |
0.511 |
7.6 |
13.6 |
|
15 |
Wellesley College |
0.498 |
7.8 |
14.4 |
|
16 |
Williams College |
0.498 |
8.4 |
15.4 |
|
17 |
North Carolina State University |
0.493 |
7.1 |
13.0 |
|
18 |
Stanford University |
0.493 |
7.5 |
13.9 |
|
19 |
University of Michigan |
0.492 |
7.5 |
14.0 |
|
- |
Composite |
0.490 |
7.4 |
13.7 |
|
20 |
Brown University |
0.489 |
8.3 |
15.7 |
|
21 |
University of Notre Dame |
0.484 |
8.4 |
16.0 |
|
22 |
Tulane University |
0.479 |
6.9 |
12.9 |
|
23 |
Rutgers University |
0.463 |
6.2 |
11.9 |
|
24 |
University of Richmond |
0.461 |
7.1 |
14.0 |
|
25 |
Carnegie Mellon University |
0.447 |
7.5 |
15.3 |
|
26 |
University of Rochester |
0.444 |
6.9 |
14.0 |
|
27 |
Purdue University |
0.443 |
6.6 |
13.4 |
|
28 |
University of Southern California |
0.440 |
7.2 |
14.7 |
|
29 |
Ohio State University |
0.430 |
5.8 |
11.9 |
|
30 |
University of Washington |
0.430 |
6.2 |
12.9 |
|
31 |
University of Chicago |
0.429 |
6.3 |
13.2 |
|
32 |
Case Western University |
0.429 |
5.8 |
11.8 |
|
33 |
University of North Carolina at Chapel Hill |
0.428 |
6.7 |
14.0 |
|
34 |
Amherst College |
0.427 |
7.5 |
16.1 |
|
35 |
Duke University |
0.413 |
7.9 |
17.4 |
|
36 |
Harvard University |
0.403 |
6.0 |
13.2 |
|
37 |
UCLA Foundation |
0.396 |
5.9 |
13.1 |
|
38 |
Cornell University |
0.389 |
6.3 |
14.4 |
|
39 |
University of Georgia |
0.385 |
6.0 |
13.8 |
|
40 |
Washington University in St. Louis |
0.366 |
7.6 |
18.8 |
|
41 |
Vanderbilt University |
0.356 |
6.4 |
16.1 |
Exhibit 4 shows graphically the relationship between total return and standard deviation of annual return. It is a textbook presentation of return and risk, with return and risk being directly related. Also plotted there is the benchmark for the composite with its asset allocation of 61%-22%-17%. Indexing with typical market exposures would have been a superior strategy for the great majority of the funds in terms of risk-adjusted return. Three funds—those of Penn, Rice and Columbia—do have Sharpe ratios a bit better than that of the index. (See Exhibit 3 for particulars.) Many funds seem far more tolerant of risk than these are but without additional compensation. Others cleave to risk in moderation but have been a good deal less successful in selecting investments.
Exhibit 4
Total Return vs. Standard Deviation of Return
(15 years ended June 30, 2023)
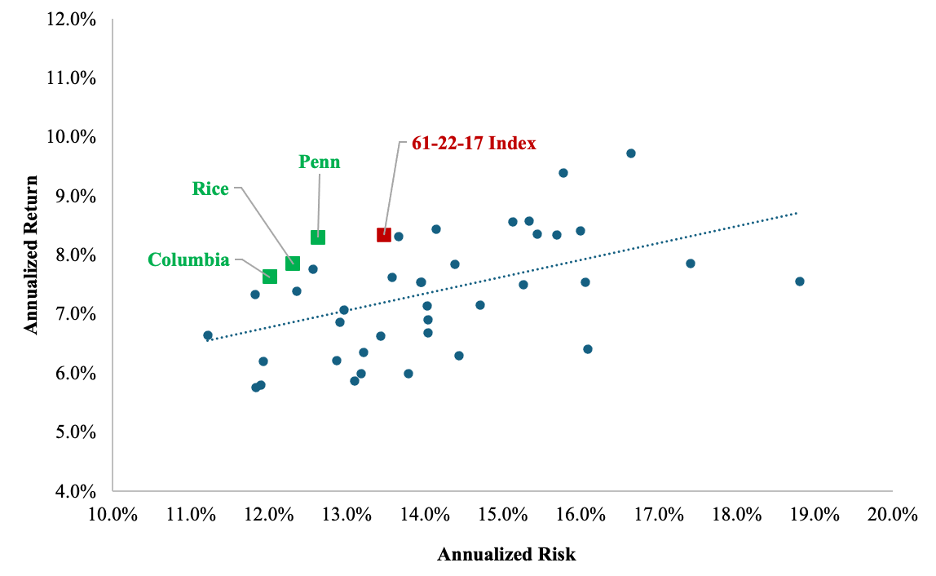
Some funds do better than others, of course. And a few do a smidgen better than passive management. But there is no sign of exceptionalism in the performance figures—not for endowments as a class and not within the class. Finance theory predicts that diversified portfolios will underperform properly constructed benchmarks over time by approximately the margin of cost. That appears to be the essence of what we are witnessing. I’ll go with finance principles over the legend and lore of investing. More endowment trustees and CIOs should do the same.
REFERENCES
Siegel, Laurence B. 2021. “Don’t Give Up the Ship: The Future of the Endowment Model.” Journal of Portfolio Management (Investment Models Issue) 47 (5): 144-149.
Sharpe, W. F. 1988. “Determining a Fund’s Effective Asset Mix.” Investment Management Review (September/October): 16–29.
——— . 1992. “Asset Allocation: Management Style and Performance Measurement.” Journal of Portfolio Management Winter: 7-19.
[1] There is no publicly available source for the returns of school endowments. I collect the data from annual reports, one school at a time, one year at a time, focusing on the largest funds. Many schools do not report returns with sufficient history to compile a return history for them. The resulting sample of 41 endowments represents a best-efforts collection process on the part of the author.
[2] I begin the analysis in fiscal year 2009 in consideration of a significant data issue affecting earlier years’ data. Prior to an accounting rule change in 2008, private assets were valued at book. The rule change required that a market-basis of valuation be used. I find evidence of return smoothing of institutional investment returns prior to 2009 that ceases to exist after the rule change. The return smoothing appears to have created an upward bias in public pension fund returns in the period 2001 to 2008. So, I start with 2009, which coincides with the Great Financial Crisis (GFC) of 2008. The GFC itself was something of a shakeout for asset pricing.
[3] I estimate that schools with large endowments incur costs of 30-60 bps per year to operate their investment offices. These costs are rarely netted out of the rates of return reported.
[4] It may take a year or two of marks aligning with market values for this phenomenon to work its way through the composite return series. It will be interesting to see the development of endowment performance over the next few years as that occurs.
[5] Rank ordered in descending order of Excess Return.

