Overexposed? Public Pension Funds Have A Lot Riding On The U.S. Stock Market, Possibly Even More Than They Realize.
Over the last 30 years, public pension funds in the U.S. have made a concerted effort to increase their allocation to non-U.S. equities, allocating funds to non-U.S. equity managers and establishing global investment management mandates. Some funds, like CalPERS, Florida, Minnesota, Texas Teachers and Virginia, to name a few, lump all their public equities together and use a global benchmark for them. It is nearly impossible, however, to know the extent of international diversification based on the funds’ reporting. Organizations like the the Center for Retirement Research at Boston College and Cliffwater LLC collect asset allocation data from the funds but make no attempt to break out U.S. and non-U.S. equity market exposures. By way of illustration, Exhibit 1 reports the aggregate asset allocation of public pension funds in the U.S. in 2020, according to Public Plans Data at Boston College. The total allocation to alternative investments is approximately 28%. Cliffwater produces a very similar tabulation in which alts account for 32% of public fund assets. These summaries, however, provide no insight into country-market exposures of public funds — not for public market assets and not for alternatives.
Exhibit 1
Asset Allocation of Public Pension Funds
|
Asset Class |
Percentage |
|
Equities |
46.5% |
|
Fixed Income |
23.2 |
|
Private Equity |
9.3 |
|
Real Estate |
8.8 |
|
Cash |
2.4 |
|
Other |
0.1 |
|
Commodities |
1.7 |
|
Hedge Funds |
6.3 |
|
Misc. Alternatives |
1.5 |
Source: Public Plans Data (Center for Retirement Research)
In “Cutting Through the Fog of Asset Class Labels,” I used returns-based style analysis (´a la Sharpe, 1988 and 1992) to estimate the broad market exposures and risk characteristics of a composite of 46 public pension funds.[1] The market exposures are summarized in Exhibit 2. Fifty-five percent of total asset exposure is represented by the U.S. equity market; 17% is non-U.S. equity (unhedged and hedged), and the remainder U.S. investment-grade bonds. I discovered two things in the course of that work:
- The funds’ approximate 30% allocation to alts did not contribute to diversification beyond that which was available by simply blending stocks and bonds, and
- The return contribution of alternative investments is predominantly domestic in character in terms of market exposure. All but about a single percentage point of the alt investment allocation was picked up by domestic stock and bond indexes in the analysis. As a result, 76% of the effective equity market exposure is with the Russell 3000 stock index, and only 24% with the ACWI ex-U.S. indexes (unhedged and hedged).
Exhibit 2
Asset Allocation by Market
|
Public Fund Asset Class |
Effective Exposure of Public Fund Composite |
As a Percentage of Total Equity Exposure |
|
U.S. Equity |
55% |
76% |
|
Non-U.S. Equity |
17 |
24 |
|
Bonds |
28 |
— |
|
Total |
100% |
100% |
The international equity diversification pattern of the pension funds is similar to that of mutual fund investors in the U.S., which have an average U.S. equity exposure of 79% according to Vanguard. In comparison, the U.S. equity marketaccounts for just 57% of the value represented by MSCI’s All-Country World Index. Thus, public funds’ U.S. equity exposure is 19 percentage points greater than the U.S. market weight. So, despite their efforts to diversify internationally, public funds retain a noteworthy home bias. Is it possible that the scramble to build out sleeves of alternative investments in recent decades had the effect of undermining to a degree the funds’ international diversification efforts? I also wonder if the funds’ managers are even aware of the extent of their effective home country equity bias.
The funds’ bias toward the home market takes on added importance in light of the extraordinary valuation level of the U.S. equity market. Exhibit 3 reports Robert Shiller’s Cyclically-Adjusted Price-Earnings Ratio (CAPE) as of June 30, 2021, for the U.S., European and Japanese markets. CAPE for the U.S. was then approximately 39. At 39, the U.S. CAPE is nearly 2.3 times its long-term average of about 17. (It reached a low of about 13 during the Global Financial Crisis.) And at CAPE of 39, investors buying U.S. equities are paying approximately 60% more for their earnings than are investors in the other principal markets. The U.S. market is very rich in both historical and contemporary (global) terms.
Exhibit 3
Extreme Valuation of U.S. Equities
at June 30, 2021
|
|
CAPE |
|
United States |
39 |
|
Europe |
24 |
|
Japan |
24 |
Source: Barclays
Analysts have identified an inverse relationship between a country’s CAPE and subsequent market performance. The implication of this work is that CAPE and other such metrics are bonafide valuation indicators, not to be dismissed lightly in the formulation of global investment strategy. On the other hand, some analysts (see Fandetti, 2021) have detected an upward drift in U.S. CAPE over the last 40 years and speculate that higher price-earnings multiples may be sustainable. They may be right. But we can’t say we haven’t been warned that U.S. equity market valuations are sky-high by historical and contemporary norms. The Japan experience offers a sober reminder that country-market-diversification matters. Japan’s share of global market value rose from less than 5% to more than 40% over the course of two decades, only to fall back to less than 10%. (See Exhibit 4.)
Exhibit 4
Global Equity Shares
1969-2019
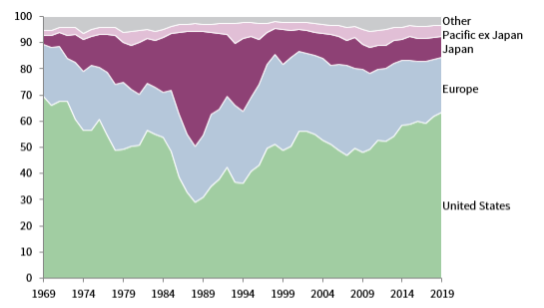
Source: Cambridge Associates
Summing up: Looking past ambiguous asset class labels, we see that the typical public pension fund in the U.S. has a sizable home equity bias. From a strategic standpoint, the home country bias issue is exacerbated by the extreme valuation of the U.S. equity market relative to other major country markets. Facing a CAPE approaching 40, U.S. equity investors are currently paying 60% more for their earnings than investors in other markets. All in all, public pension funds are betting heavily on the home market, and paying up to do so. International diversification, and with it, country market valuation, are bread-and-butter issues of managing a globally-oriented portfolio. Now is the time for institutional investors to revisit the factual and logical basis of international investment strategy. The sooner they do, the greater the likelihood of their having in place a strategy that comports with theory and evidence when it matters most.
REFERENCES
Ennis, R.M. 2022. “Cutting Through the Fog of Asset Class Labels.” Journal of Investing. February.
Fandetti, M. 2021. “A Time-Series Analysis and Forecast of CAPE.”
Journal of Portfolio Management, 47 (8) 138-150.
Sharpe, W. F. 1988. “Determining a Fund’s Effective Asset Mix.” Investment Management Review (September/October): 16–29.
——— . 1992. “Asset Allocation: Management Style and Performance Measurement.” Journal of Portfolio ManagementWinter: 7-19.
[1] To obtain market exposures, I regressed composite returns on those of four independent variables, viz., Russell 3000 stocks, MSCI ACWI ex-U.S. stocks (unhedged and hedged indexes) and Bloomberg Barclays Aggregate U.S. bonds. The regression R2 is .992 and tracking error is 1.0%.

