How to Improve Institutional Fund Performance
Ennis (2020) is an empirical study of the performance of public pension funds in the U.S. Ennis (2021) similarly examines the performance of educational endowment funds in the U.S. Both articles identify significant and pervasive underperformance on the part of these groups of institutional investors. Ennis (2021a) critically examines the so-called endowment model, some form of which is widely employed by institutional investors in the U.S. and beyond. That article, “Failure of the Endowment Model,” finds that, as the endowment model has evolved over nearly three decades, it has developed features that seriously hamper institutions’ efforts to achieve competitive returns. This essay sums up the prior articles and describes the types of actions necessary to make institutional investing more efficient. Whereas the prior articles were empirical and/or analytical in nature, this essay is largely prescriptive. It lays out clearly what investors must do to improve their lackluster results.
PUBLIC PENSION FUNDS
The collective holdings of defined benefit pension plans for public employees constitute the largest pool of institutional investments in the U.S. These plans have assets of $4.5 trillion. Their beneficiaries include 14.7 million active workers and 11.2 million retirees.[1] The plans are largely funded by taxpayers. The stakeholders — public workers and taxpayers — have no real say in the management of plan assets.
Performance
A composite of large public funds underperformed a properly-constructed, passively-investable benchmark by 155 bps per year for the 12 years ended June 30, 2020.[2] The composite underperformed the benchmark in 11 years out of 12. Of the 46 individual funds making up the composite, 2 had statistically significant positive alphas, and 30 had statistically significant negative alphas.[3]
Custom Benchmarks
A number of public pension fund officials — perhaps a majority of them — might say that the findings reported above do not apply to them because they have outperformed their custom benchmarks or at least matched them. These are performance benchmarks of the funds’ own devising that they employ in their annual reports. I compared returns reported for the custom benchmarks of 10 of the largest U.S. public funds over the decade ended June 30, 2018, with the returns of properly-constructed, passively-investable benchmarks tailored for each of those funds. I found that the former (custom benchmarks) averaged 149 bps per year less return than the latter (passively-investable benchmarks) for those funds. Moreover, none of the custom benchmarks had a return greater than that of the corresponding passively-investable benchmark. In other words, there is evidence of a sizable downward bias in the returns of custom benchmarks. Accordingly, when reviewing a fund’s presentation of its performance relative to its custom benchmark, take notice: The fund may be chasing a slow rabbit.
The bottom line on public pension fund performance is that underperformance of 155 bps per year on $4.5 trillion in assets translates to an outright waste of stakeholder value of nearly $70 billion a year, a figure I find astonishing.
Diversification and Cost
A hallmark of public fund investing is extreme diversification. Trustees of these funds are generally laypersons operating in a public forum under a fiduciary standard that encourages them to be cautious. Large public funds use an average of 182 investment managers, commingled funds and partnerships (“managed portfolios”).[4] They index about 22% of their assets.[5] Their typical allocation to alternative investments is approximately 30% of assets.[6] The typical (median fund) R2 diversification measure with stock and bond indexes is just shy of .99, meaning the fraction of return-variance that goes unexplained by stock and bond indexes is minuscule, despite the significant allocation to alternative investments. Their typical annual investment expense is approximately 1.1% of asset value.[7] A fund with this degree of diversification and level of cost constitutes a very costly closet index fund, with poor prospects for keeping up with a passively-investable benchmark over time.
Challenging Operating Environment
Public funds exist in an environment that is not conducive to generating excess return in highly competitive markets. Many are huge. They operate in a goldfish bowl, where investment activities are scrutinized and often politicized. They are subject to governmental restrictions and bureaucracy. Their investment staffs are typically compensated at a lower rate than many in the private sector. In several important respects, public funds are attempting to compete with one arm tied behind their back.
Jurisdictional Redundancy
A taxpayer residing in the City of Los Angeles has a piece, so to speak, of at least six different governmental pension fund investment portfolios. By this I mean the taxes the resident pays are affected by the performance of (1) the Los Angeles City employees’ pension fund, (2) the Los Angeles fire and police fund, (3) the Department of Water and Power fund, (4) the Los Angeles County employees’ fund and, at the state level, (5) the California Public Employees fund and (6) the California State Teachers fund. If one fund performs above benchmark and another below benchmark, there is a netting out of gains and losses. Moreover, each of the pension funds mentioned above operates with a market R2 of approximately .99.[8] Imagine the six funds’ investment portfolios overlaid one upon another and you have a picture of the grandest closet index fund on the planet. The only problem is that this grand index fund incurs annual costs on the order of 1.1% of asset value. In theory, the problem could be mitigated some by pooling the investments of the various pension funds operating within the state, but that is politically impractical. Indexing is the only solution to the problem of jurisdictional redundancy.
Solution
The case for next-to-no-cost passive investment of public pension funds in their entirety is overwhelming. There is simply no justification for managing them actively. It is time for public fund trustees to wake up to the facts. Trustees can accomplish passive investment in whatever asset-allocation configuration they choose. Large funds can do it for a single basis point of expense. The smallest fund in the country can do it at Vanguard for five basis points. It is time to put an end to the enormous waste of precious public resources that results from the way public pension funds are managed in the U.S. today.
LARGE ENDOWMENTS
Performance and Cost
Large educational endowments have actually performed worse than public pension funds since the GFC of 2008. For the 12 years ended June 30, 2020, the public fund composite described above had a risk-adjusted return (alpha) of -1.52% per year. NACUBO’s composite of approximately 100 endowments with assets greater than $1 billion had an alpha of -1.87%, for a difference of 35 bps per year.[9] In terms of consistency, the endowment composite underperformed its passively-investable benchmark in 12 years out of 12 since the GFC. Of the 43 individual funds studied, only 1 had a statistically significant positive alpha, and 16 had statistically significant negative alphas. [10]
Even most elite university investment offices underperformed. Here are a few insights into how 11 of them did relative to passively-investable benchmarks over the past 12 years. The schools are Brown, Columbia, Cornell, Dartmouth, Harvard, MIT, Notre Dame, Penn, Princeton, Stanford and Yale. Two had positive alphas and nine had negative alphas. None had a statistically significant positive alpha, and four had statistically significant negative ones.
Sophisticated endowment management has become a very expensive proposition. This is due in large part to heavy reliance on pricey alternative investments, which account for approximately 60% of the assets of large endowments.[11] I estimate the cost of investing large endowments at approximately 1.8% of asset value per year.[12] The endowments’ cost approximates their observed alpha of -1.82%. To the extent markets are efficient, we would expect a 100-fund composite of diversified portfolios to underperform passive investment by its margin of cost, so these results come as no real surprise.
Similarities to Public Pension Funds
From a financial-markets-and-institutions standpoint, there is no inherent difference between endowment funds and public pension funds in terms of how they might be expected to perform before costs. Both are tax-exempt investors in the U.S. Both are institutional funds that would describe themselves as having an amply-long investment horizon for equity investing. Very similar fiduciary standards apply to both. Both operate in the same highly competitive markets. Both diversify their investments extensively. They exhibit remarkably similar exposures to major stock and bond markets.[13] Their patterns of return-variability over time are virtually identical. (See Appendix.)
So why do we commonly think of large endowment funds as being somehow different than public pension funds?
Differences
There are, in fact, a few important differences between public pension funds and private endowed institutions that should be acknowledged. For one thing, the latter are private. The schools are managing their own money, not that of absent stakeholders. In my book, that entitles them to manage their assets as they please within the bounds of conventional fiduciary law. In this respect, it is important to acknowledge that there exists a long-standing ethos within the endowment management community in the U.S. to the effect that these institutions are, or should be, savvy investors. I won’t begin to attempt to describe this ethos further; nor will I attempt to justify or critique it. Suffice it to say the phenomenon is real: Most trustees of private universities with large endowments do believe that they can and should do better than average. In their eyes, this requires an active approach to investing. This is all well and good; as I say, these are private schools managing their own money. To have a chance of succeeding, however, they must modify their approach.
Problems with the Contemporary Endowment Model
Ennis (2021a), describes problems with the paradigm that has evolved for managing large endowment funds. Here is a summary of the issues:
Hard Asset-Class Allocations. Large endowments employ several asset-classes, or silos, in an effort to achieve optimal diversification. In addition to stocks and bonds, these asset classes include ones for alternative investments, such as private equity, hedge funds and private-market real estate, to name few. In fact, however, the multi-asset-class model has been shown to have no real diversification functionality.[14] That is, the diversification pattern resulting from allocating to numerous asset classes, including in large measure to alternative assets, is no better than that which can be obtained with a few stock and bond index funds alone. (See Appendix for a brief summary of this research.) This finding has important implications for the investor. One is that all active investments must be justified in terms of their potential to generate a positive alpha and not merely because they help fill out the target allocation, or quota, for a particular asset class. Investors must look to alternative assets, in particular, for genuine alpha and not with the expectation of securing an exotic beta or other benign diversifying influence, for none is evident in the returns of alternatives. Nor is there theoretical justification for such.
Asset-class silos, however, impose rigidity. Once an allocation of, say, 10% of fund assets is made to illiquid private equity, the fund manager obliges themself to fill that commitment with the best-looking deals among those that come along. But what if private equity, in general, is not a source of value-added? In this regard, it is worth noting that private equity (as a class of investment) in fact ceased to be a source of value-added more than a decade ago.[15] So did hedge funds.[16] And private-market real estate, too.[17] In view of these facts and absent a genuine role in bringing about efficient diversification, static allocations to very expensive, largely illiquid, active asset classes without assurance of added-value is no way to run smart money.
Too Many Managers, Too Much Cost. In 1994, when the heyday of endowment investing was just gathering steam, the average number of managed portfolios, including managed accounts, commingled funds and partnerships employed by large endowments was approximately 18.[18] The average number of managed portfolios employed by large endowments in 2019 was 108.[19] Some of those portfolios comprise bonds, some common stocks, some shares of private companies, some hedge fund positions, some commodities and some real properties. The proliferation of portfolios is no doubt due in part to a desire to diversify holdings within a number of asset class silos. But if overall fund diversification does not derive from supposedly uncorrelated asset classes, then managed portfolios of all stripes are just that — managed portfolios. Each involves risk that is market-related and risk that is not. Each has a cost and, in the eye of the rational investor, each must provide the expectation of an excess return owing to manager skill. And identifying managers — traditional or alternative —that will generate excess risk-adjusted returns happens much less frequently than almost anyone would care to admit. The vast majority of endowments are not producing positive alphas, which means the managers they have hired are having difficulty doing so. In light of this, endowment managers would be wise to use fewer portfolio managers, concentrating on finding a smaller number of truly exceptional ones. Additionally, they absolutely must reduce the cost of investing. Exhibit 1 provides an illustration of the challenge of succeeding with a large number of managers and high cost. It is theoretical rather than empirical in nature, and stylized to illustrate the forces at work. Simplifying assumptions include: All managers have the same size portfolio, each of which has tracking error of 8%. Managers’ active risk is uncorrelated. The endowment fund manager believes each portfolio manager will produce an annual excess return of 1.6% for an information ratio (IR) of 0.2. (The excess return assumption and positive IR are truly arbitrary in that they present a much more promising picture of institutional investing than has been borne out in practice. But if we don’t assume some degree of manager skill, plus skill on the part of the fund manager in identifying skillful managers, there is no point in having any assets actively managed. So we use an IR of 0.2 more as a “plug” than anything else.) The time horizon is 10 years. Exhibit 1 shows the probability of an endowment achieving a positive excess return for three levels of annual cost (1.2%, 1.5% and 1.8% of asset value) as a function of the number of managed portfolios employed.
Exhibit 1
Probability of Outperforming over a Decade
Based on Manager Diversification and Cost
(Manager Information Ratio: 0.2)
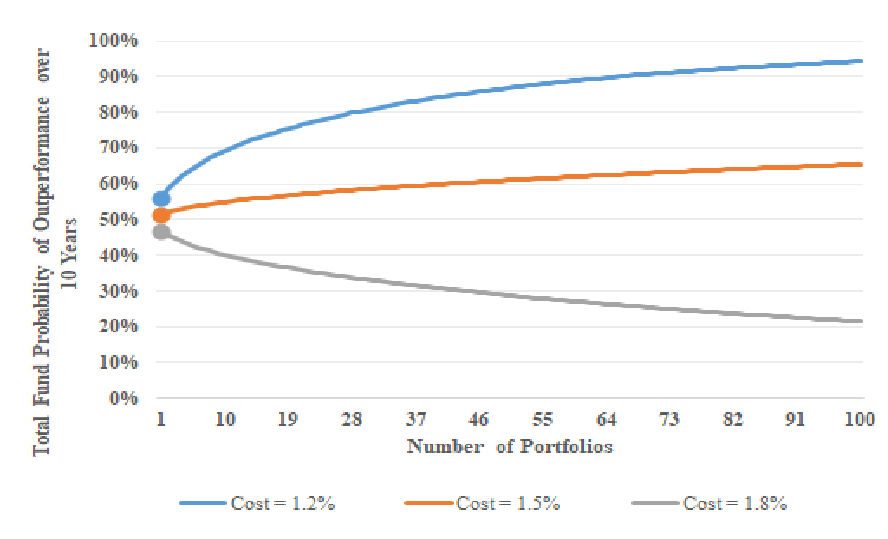
Even plugging in a generous assumption about the potential of active investing to add value, with typical endowment management costs of 1.8% per year, the endowment has less than a 50-50 chance of adding value with a single manager. Increasing the number of managers only worsens the situation. A cost reduction of 17% (to 1.5% of asset value), tips the odds slightly in favor of the investor. With a one-third reduction in cost (to 1.2%), the investor is poised to experience positive value-added. Moreover, with cost and performance expectations in balance this way, adding active managers actually enhances one’s prospects. But the marginal benefit of doing so diminishes sharply once the manager count reaches about 20.
Recommendations
There is no sure way to beat properly-constructed, passively-investable benchmarks. Endowment managers can, however, improve their performance prospects. Here’s how:
Simplify Asset Allocation: Fewer Categories, No Active Quotas. Consider an asset-allocation scheme with just three investment categories, or buckets: Stocks, Bonds and Active. Here, the Stock and Bond allocations are passively managed in broad-market formats and together might well constitute a large fraction of the portfolio. Think of the passive funds collectively as making up the fund’s passive core. All forms of active investment — ones involving marketable securities and alternative investments — are included under Active. Assume further there are no quotas to fill in individual areas of active investment, such as placing 10% in private equity or 15% in hedge funds. This rather extreme simplification is at the other end of the asset-allocation spectrum from where endowment managers find themselves today. As an alternative paradigm, it represents the essence of flexibility, risk control and opportunity for cost control. With this in mind, endowment managers should begin to explore simpler, more flexible concepts in asset allocation. As they do, surely they will begin to migrate away from the hard-silo model to one with fewer rigid categories, sans quotas for various types of active investment.
Lower Costs, Fewer Managed Portfolios. Diversification is one manifestation of risk tolerance, which is an institutional attribute rather than an element of strategy. An indication of institutional preference for endowment diversification is the typical 2.5% tracking error cited above. More generally, large endowments’ tracking error falls within +/- 0.8% of that norm, indicating a fairly homogenous expression of risk tolerance on the part of trustees for their endowment investments. There is no reason to believe endowments are likely to become more concentrated in their investing. Indeed, endowments have been moving in the direction of greater diversification in recent decades. What they must do now is replace grossly inefficient diversification with diversification that is efficient.[20] How to do this?
A good place to start is by reducing cost. There is simply no way endowed institutions can invest efficiently under the prevailing cost structure. Costs must come down! Second, there is no way to achieve above-market performance if the manager is unable to identify skilled managers. If the manager can indeed consistently pick the comparatively few winners that will emerge after the fact, there is no advantage in hiring scads of managers. Ten to 20 will do the job nicely. And limiting the number of picks can only increase the likelihood of successful picking.
What if the endowment manager can’t bring themself to live with as few as 10 or 20 managed portfolios across the spectrum available? This is understandable in view of an existing culture of manager proliferation and an infatuation with alternative asset types. The correct response to this concern is to increase the passive core portfolio mentioned above at next to no cost. The size of the passive core depends on the comfort level of the endowment manager in living with a lean active portfolio. If the manager is uncomfortable with an active portfolio of their 10 or 20 best picks, the proper response is to increase the size of the passive core, not the number of managers.
SMALL ENDOWMENTS AND OTHER NONPROFITS
There are countless small endowments, foundations and other nonprofit investors in the U.S. Their assets are as dear to them as the assets of institutions with large endowments are to them. And the little guys really need help.
For this category of investor we have 46 years of data to learn from. The NACUBO cohort of funds with assets less than $25 million had an average annual return in excess of benchmark of -1.2% per year between 1974 and 2019.[21] Small endowments outperformed the benchmark by a percentage point or more in just 3 of the 46 years. Small funds are disadvantaged by having to pay the highest rate of charge for asset management given typical graduated fee schedules. They also tend to be heavier users of expensive funds of funds in an effort to extend their reach. For nearly half a century, institutions with small endowments have been contributing more than 1% of their assets annually to the investment management and brokerage industries without benefit. Lacking the resources and necessary scale for astute endowment management, small institutions should drop active investing altogether and opt for passive management.
CONCLUSION
Large institutional investors in the U.S. have encumbered themselves with an outdated, clumsy diversification framework that involves largely static allocations to asset-class silos, including ones for investments that are purely active in nature and, as classes of investment, may have long ago ceased to be fruitful sources of added-value via alpha or an exotic beta return. They use so many managers as to choke off the opportunity to beat the market. They incur annual costs of 1.0 to 2.0% of asset value. Those costs, taken with prevailing institutional preferences for diversification, are implausible on their face. It is no wonder that public pension funds and large endowments have underperformed properly-constructed, passively-investable benchmarks by approximately 1.5% and 1.8% per year, respectively, in the modern era.
The very nature of public pension funds and small endowments is such that beating the market is not a realistic expectation. Both types underperform passive investment by the full margin of their cost, and they do so with remarkable consistency. Trustees of these funds should put an end to the waste of precious resources and invest passively at next to no cost.
Private institutions with large endowments would, in the main, be better off investing passively. There is no reason to believe, however, that the trustees of most of those august institutions will be persuaded to become “indexers” anytime soon. To have any chance of succeeding with their activist style, they and their investment managers should (1) simplify their approach to asset allocation, (2) use far fewer managers and (3) reduce cost.
My term for the whole of institutional investing as we know it today is The Great Game. The Game has many participants. All of them — trustees, staff, consultants, investment managers and market-makers of all types — are agents of the stakeholders. The agents have incentives to maintain the status quo, to keep the The Game alive, as it were. It is time for those at the top of the heap of agents — the trustees — to awaken to the realities of contemporary institutional investing and to change the way The Game is played. It must become more scrupulous. And more efficient.
APPENDIX
Here we compare the performance of two institutional investor composites beginning June 30, 2008. One composite includes 46 large public employee pension funds in the U.S. The other composite is NACUBO’s cohort of approximately 100 endowments with assets greater than $1 billion. We devised a benchmark for each composite using returns-based style analysis with three indexes: Russell 3000 for U.S. stocks, MSCI ACWI ex-U.S. for non-U.S. stocks and Bloomberg Barclays U.S. Aggregate bond index for U.S. investment grade bonds. Both benchmarks are roughly 70% stocks and 30% bonds. We regressed the composites’ returns on their respective benchmark returns for the 12 years ended June 30, 2020, to evaluate their performance in risk-adjusted terms. Exhibit A1 illustrates the results, which are strikingly similar. In fact, we overlay the endowment regression on that of public funds in order to emphasize their near-congruity. Both regressions have a very tight fit, with R2’s of 99.1% (for public funds) and 98.5% (for endowments), and standard errors of regression of 1.4% or less. It is worth emphasizing that these are two entirely different sets of institutional actors and investment portfolios. But in terms of their performance footprints, the two are so similar as to be virtually indistinguishable. For example, taking a closer look at Exhibit A1, we can see that 9 of the 12 annual endowment plot points (in orange) are so close to their pension fund mates (in blue) as to at least partially obscure them. In the same vein, at first it may not be clear whether there are two regression lines or a single blurry one.
Exhibit A1
Public Fund and Endowment Composite Returns
Versus Stock-Bond Benchmarks
(12 Years Ended June 30, 2020)
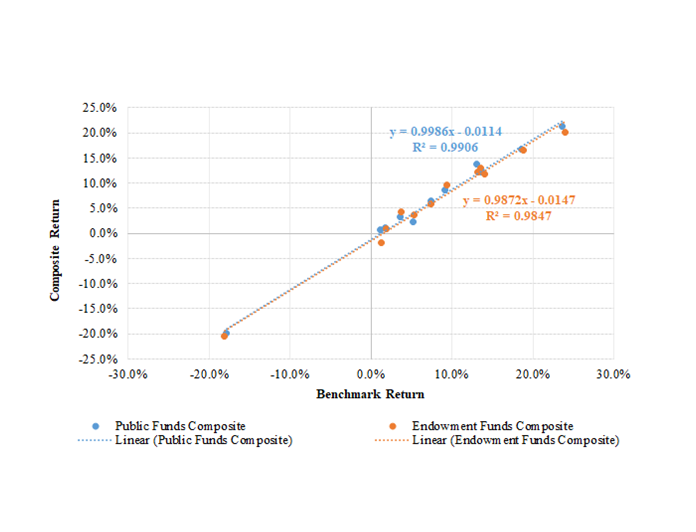
It is important to note that both composites reflect large allocations to alternative investments. For the public fund composite, the alternative asset percentage is approximately 30%; for the endowments the figure is approximately 60%. In this regard, Exhibit A1 demonstrates that stock and bond indexes have captured the return-variability characteristics of alternative investments in composites of institutional funds for all intents and purposes. Alternative investments did not have a meaningful impact on their risk-return signature. Rather, alternative investment returns simply blend in with broad market returns in the context of standard portfolio analysis.
REFERENCES
Aubry, Jean-Pierre and Kevin Wandrei. 2020. “Internal Vs. External Management for State and Local Pension Plans.” Center for Retirement Research of Boson College, No. 75, November.
Beath, Alexander and Christopher Flynn. 2020. “Benchmarking the Performance of Private Equity Portfolios of the World’s Largest Institutional Investors: A View from CEM Benchmarking.” Journal of Investing, December.
Ennis, Richard M. 2020. “Institutional Investment Strategy and Manager Choice: A Critique.” Journal of Portfolio Management (Fund Manager Selection Issue): 104-117.
Ennis, ______. 2021. “Endowment Performance.” The Journal of Investing, April.
Ennis, ______. 2021a. “Failure of the Endowment Model.” Journal of Portfolio Management (Investment Models issue).
Sharpe, W. F. 1988. “Determining a Fund’s Effective Asset Mix.” Investment Management Review (September/October): 16–29.
Sharpe ______. 1992. “Asset Allocation: Management Style and Performance Measurement.” Journal of Portfolio Management Winter: 7-19.
Sullivan, Rodney N. 2020. “Hedge Fund Alpha: Cycle or Sunset?” Journal of Alternative Investing. Winter 2021, 23 (3) 55-79.
[1] See Public Plans Data, Center for Retirement Research at Boston College.
[2] A properly-constructed, passively-investable benchmark is defined as follows: A combination of cheaply investable index returns that matches the subject return series as well or better than others in terms of (1) measures of statistical fit and (2) market exposures. I use the returns-based style analysis technique innovated by Sharpe (1988, 1992) to create such benchmarks. (The process is elaborated on in Ennis, 2020.) The return series of the public pension fund composite described here has an R2 of .991 and a beta of .999 relative to the benchmark. The bencmark has an effective exposure to globally-diversified equites of 71% and investment-grade U.S. bonds of 29%. See also Beath and Flynn (2020) for a discussion of benchmark criteria employed by CEM Benchmarking.
[3] These figures, which originally appeared in Ennis (2020) and were for the 10 years ended June 30, 2018, were updated through 2020 by the author.
[4] See Aubry and Wandrei (2020).
[5] Greenwich Associates.
[6] Public Plans Data, Center for Retirement Research at Boston College.
[7] The cost estimate is derived as follows: Seventy percent of assets are marketable securities, and 30 percent are alternative investments. Twenty percent of total assets are passively invested. I estimate the cost of active and passive marketable securities management, including transaction costs, at approximately 0.5% of asset value. I estimate the cost of a diverse portfolio of alternative investments to be 2.5% of asset value. These estimates result in a total cost of 1.1% of asset value annually. (See Ennis, 2020, for a further discussion of cost estimation.) Some public fund officials might quibble with the cost estimate here. It is not clear that the fund managers even know how much they are paying for investment management. CEM Benchmarking found that the funds underreport their investment costs by half. See https://www.top1000funds.com/2020/11/asset-owners-report-half-of-all-costs/
[8] See, for example, Ennis (2020), Exhibit 9.
[9] These figures originally appeared in Ennis (2020) for the 10 years ended June 30, 2018, and have been updated by the author through June 30, 2020.
[10] These figures originally appeared in Ennis (2021) for the 11 years ended June 30, 2019, and have been updated by the author through June 30, 2020.
[11] See 2020 NACUBO-TIAA Study of Endowments.
[12] The cost estimate is derived as follows: Forty percent of fund assets are marketable securities with next to no passive investments and a cost (including transaction costs) of 0.7% of asset value. Sixty percent of assets are diverse alternative investments with a cost of 2.5% of asset value. This results in a total cost estimate of 1.78% of asset value. See Ennis (2020) for a further discussion of cost estimation.
[13] The public fund composite has a returns-derived effective exposure to globally-diversified equites of 71% and investment-grade U.S. bonds of 29%. The equity allocation of the endowment composite is ever-so-slightly greater at 72%.
[14] See Ennis (2021a).
[15] See Beath and Flynn (2020).
[16] See Sullivan (2021).
[17] See “Updated 20-Year CEM Benchmarking Study Highlights REIT Performance versus Private Real Estate” (NAREIT, https://www.reit.com/data-research/research /updated-cem-benchmarking-study-highlights-reit-performance).
[18] The author estimated the average number of managers for 1994 from data contained in the NACUBO Study of Endowments for that year.
[19] See the NACUBO 2019 Study of Endowments.
[20] Sometimes inefficient diversification is referred to as “over-diversification.” The latter term makes no sense in finance terms. Investors can and commonly do diversify inefficiently, overpaying for the diversification they get. For this reason I refer to diversification as being either economical or inefficient.
[21]See Ennis (2021), Appendix, for particulars.

