Failure of the Endowment Model
Trustees of public pension funds and large endowments in the U.S. are in a bind. With the help of staff, consultants, asset managers, assorted pundits and a media chorus, they have rationalized dividing their portfolios into as many as a dozen sub-portfolios, commonly known as asset classes. They have made allocations to so-called alternative investments, or “alts,” that are vastly disproportionate to the alts’ representation in the marketplace (opportunity set). Additionally, trustees act as if they believe they can beat the market with more than 100 investment managers, which they compensate to the tune of 1-2% of the value of their assets each year. None of this is working for them, and certainly it is not working for the stakeholders of these funds. Ennis (2020) found that public pension funds collectively have underperformed passive investment by 1.0% per year and large endowments by 1.6% per year. It is time for fiduciaries to recognize that they have not merely been unlucky. Rather, their strategy has failed them.
THE ENDOWMENT MODEL
The majority of large institutional investors in the U.S. have adopted an investment strategy often referred to as the Endowment Model (EM). The approach was innovated by Yale University in the 1980s and popularized by other large educational endowments in the 1990s. Today, this investment strategy is ubiquitous among large public pension funds as well as endowment, foundation and other nonprofit funds with collective assets exceeding $5 trillion.
Asset-Class Architecture
Under the EM, the investor identifies a number of asset classes that, in the investor’s eye, offer the promise of a satisfactory return for the associated risk, i.e., an adequate risk premium. The asset classes constitute the essential architecture of diversification for the EM. The asset classes include stocks and bonds. They also include a number of forms of alternative investment, such as:
- Leveraged buyouts
- Venture capital
- Private-market real estate
- Hedge funds
- Managed futures
- Various forms of high-risk debt
- Infrastructure
- Natural resources / commodities
Advocates of the EM generally believe that alternative investments transact in markets that are less efficient than stock and bond markets. To the extent this perception is accurate, it provides skillful investment managers with the opportunity to exploit mispricing, potentially adding an active-management premium to the risk premium.
A Diversification Effect Like that of Stocks and Bonds
Common stocks provide the expectation of growth with uncertainty. Bonds provide a lesser expected return with relative stability. Bills provide the least return over the long run but with year-to-year certainty. These are integral features of securities that derive from the design of the instruments and their resulting cash flow patterns. By virtue of these fundamental differences, stocks and bonds exhibit a consistent pattern of relative volatility over time: bonds regularly exhibit a fraction of the volatility of stocks. Furthermore, the average correlation of stocks with bonds in the U.S. has averaged a mere 0.17 during the 44 years ended December 31, 2019, with an upper bound of 0.64 and a lower bound of -0.47.[1] For these reasons, stocks and bonds have proven to be reliable building blocks in bringing about the diversification effect shown in Exhibit 1, resulting in an efficient frontier consistently convex in the direction of the vertical axis.
Exhibit 1
The Stock-Bond Diversification Effect
Periods Ended December 31, 2019
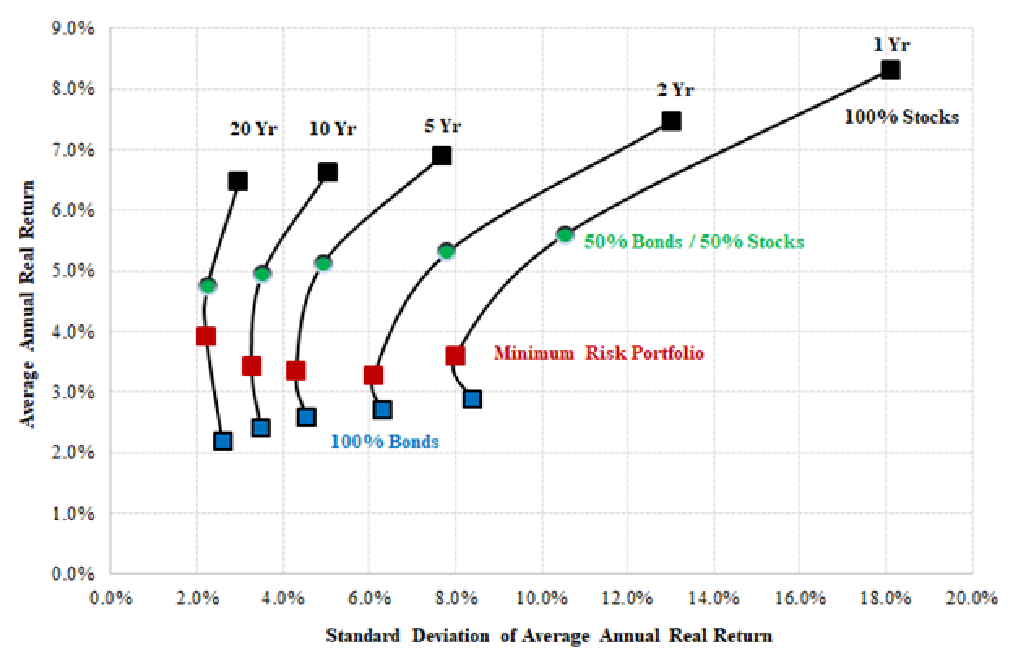
Advocates of the EM ascribe these same diversifying features to alternative assets, as well. Their returns are sometimes described as “uncorrelated” with traditional assets and one another. In practice, most asset-class returns tend to be positively correlated to some extent, just not perfectly. Even so, imperfect positive correlation is sufficient for a diversification effect to kick in, and thus the inclusion of alternatives would provide a further bump up in expected return per unit of risk.
Emphasis on Alternative Investments and Active Management
Most alternative asset classes are actually active investment strategies for which there is no passively investable equivalent. Selecting one’s asset classes is a largely subjective affair — beauty being in the eye of the beholder. There is no universal set of “approved” asset classes (beyond stocks and bonds) from which to choose. Nor are there hard-and-fast rules governing the weighting of asset classes. Typically, the number of asset classes used is 8 to 12, and they tend to be fairly static once adopted. Exhibit 2 shows the principal asset classes used by large endowments as reported by NACUBO. The aggregate value of alternative investments is just shy of 60% of the value of the NACUBO composite of endowments with assets greater than $1 billion. Alternatives made up 28% of public pension portfolios in 2019.[2]
Exhibit 2
Asset Allocation: Large Endowments vs. Opportunity Set
June 30, 2019
|
Asset Class |
NACUBO Large Endowments |
Opportunity Set |
Over/ Underweight |
|
U.S. Equity |
14.3% |
32.2% |
-17.9% |
|
Non-U.S. Equity |
17.0 |
16.1% |
0.9% |
|
Public Fixed Income |
9.3 |
41.4% |
-32.1% |
|
Subtotal Traditional Assets |
40.6% |
89.7% |
- |
|
Real Estate |
6.2 |
1.1% |
5.1% |
|
Venture |
9.0 |
1.0% |
8.0% |
|
Leveraged Buyouts |
13.6 |
2.2% |
11.5% |
|
Hedge Funds |
20.5 |
3.4% |
17.1% |
|
Private Debt |
1.2 |
0.9% |
0.3% |
|
Infrastructure and Natural Resources |
6.3 |
0.9% |
5.5% |
|
Other[3] |
2.4 |
0.8% |
1.6% |
|
Subtotal Alternative Investments |
59.4% |
10.3% |
- |
|
Total |
100.0% |
100.0% |
- |
Exhibit 2 also includes our characterization of the composition of U.S. institutions’ investment opportunity set, which had an aggregate value of $94 trillion in 2019.[4] Alternative investments, collectively, account for just 10% of the opportunity set; individual alternative asset categories — at 1% to 3% each — are mere slivers of the whole. The difference between the average allocation and the opportunity set is striking in that the endowments heavily overweight alternative assets at the expense of domestic stocks and bonds. One view of the large differences between actual allocations and the opportunity set is that, in fact, the allocations represent large active bets more so than diversification. Under an equilibrium-asset-pricing interpretation of markets, such as CAPM, the bets reflect a strong non-consensus view of expected return, variance and covariance for the asset classes. For some observers, this has raised a cautionary flag about the heavy emphasis on alternative assets. We seek to shed light on this issue in the present paper.
An indication of the disposition of institutional investors to active investing is their modest use of passive management. Large endowments invest just 6% of their assets passively. The figure for public pension funds is 21%.[5] The institutions’ preference for active management, be it alternative or traditional, is reflected in the costs they incur.
Cost
The cost of investing has risen markedly with the advent of alternative investing. We posit that equity-oriented portfolios of marketable securities cost the investor 0.5% to 0.9% of asset value, the percentage varying with fund size, the mix of stocks and bonds, the use of passive versus active management and turnover rates. This serves as an indication of the level of institutional investment expense prior to the introduction of alternative investments. The cost of alternatives begins at about 1% of asset value for open-end diversified (core) equity real estate funds. Estimates of the cost of private equity investing approximate 6.0% of invested capital.[6] The cost of hedge funds, non-core real estate and private debt fall between the extremes. We estimate the cost of a typical portfolio of diverse alternative investments to be in the range of 2 to 4% of asset value annually. We further estimate that across the spectrum of institutional investors, their cost of investing at the total-fund level ranges from 1 to 2% of assets. In our empirical work (Ennis, 2020) we estimated the average investment expense for public pension funds at 1.1% of asset value annually. We estimated the average cost for large endowments, with roughly twice the average exposure to alternative investments, at 1.7% of asset value annually.[7]
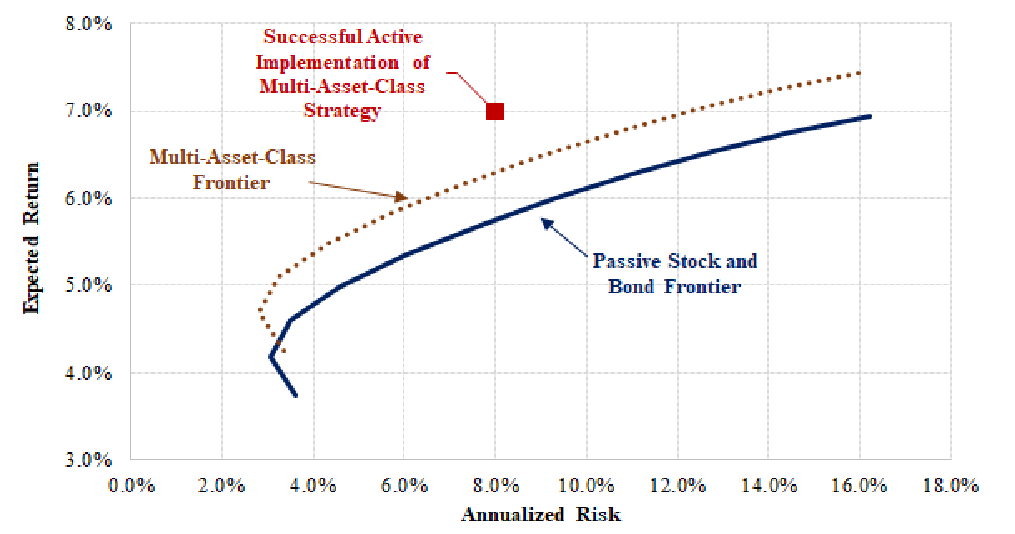
The Goal
Exhibit 3 illustrates the desired outcome from skillful implementation of the EM. It shows the classic frontier of portfolio theory, consisting of a series of passively-invested combinations of stocks and bonds. Resting atop that frontier is another, which includes a number of imperfectly correlated asset classes such as those shown in Exhibit 2. Finally, a hypothetical portfolio, reflecting skillful active management of and within the several asset classes, is plotted above that. It is superior to any portfolio outcome lying on either frontier. This is what the EM is all about — maximizing risk-adjusted return by combining many “uncorrelated” asset classes and employing skillful active management. The next section examines how well the EM has performed.
Exhibit 3
Hypothetical Efficient Frontiers
With Skillful Active Management
PERFORMANCE
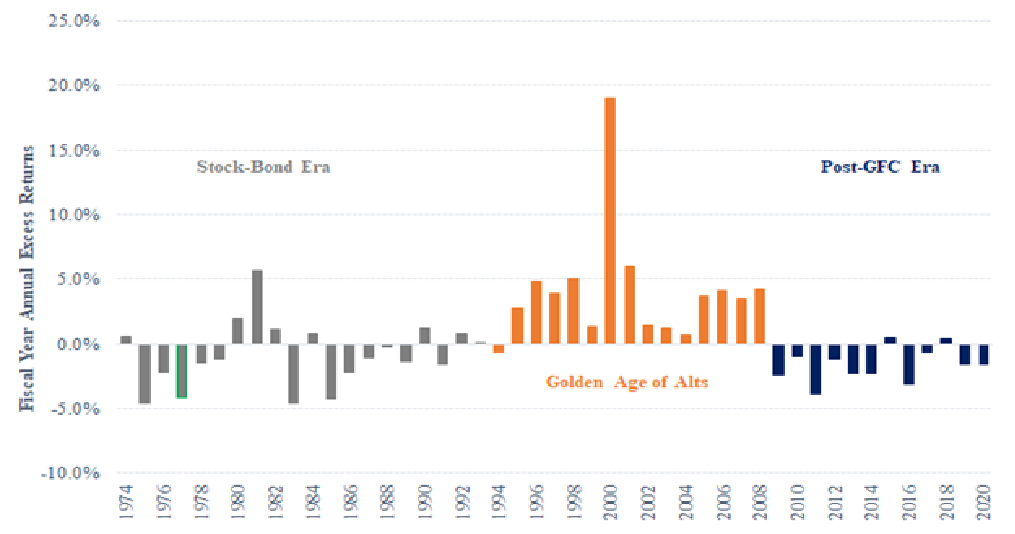
Three Eras of Endowment Returns
Ennis (2021) identifies three eras of excess return (market-risk-adjusted performance) for NACUBO’s large endowment composite between FY 1974 and FY 2020.[8] The results are shown in Exhibit 4. During what we describe as the Stock and Bond Era (FYs 1974-1993), the endowments averaged less than 10% in alternatives. Average annual excess return during the first era was -0.8%, which approximates the margin of cost for that period. During the Golden Age of Alternative Investments (FYs 1994-2008), the endowments experienced extraordinary risk-adjusted performance with an average annual excess return of +4.1%. The favorable performance was largely due to the impact of alternative investments, which averaged 34% of the composite’s value during that era. During the final era (FYs 2009-2020), which we refer to as the Post-GFC (Global Financial Crisis) Era, the endowments averaged 54% in alternative investments and underperformed by about 1.6% per year, which is the approximate margin of cost during that era. Two things stand out in Exhibit 4. The first is the exceptional performance of large endowments during the Golden Age, a topic that has been widely noted and much discussed. Exhibit 4 defines that era in terms of its duration and the magnitude of its gains. The second striking feature is the sharp reversal of fortune beginning about the time of the GFC and the consistent underperformance in the ensuing years. What accounts for the abrupt shift in endowment performance in the wake of the GFC?
Exhibit 4
47 Years of Excess Return for Large NACUBO Endowments
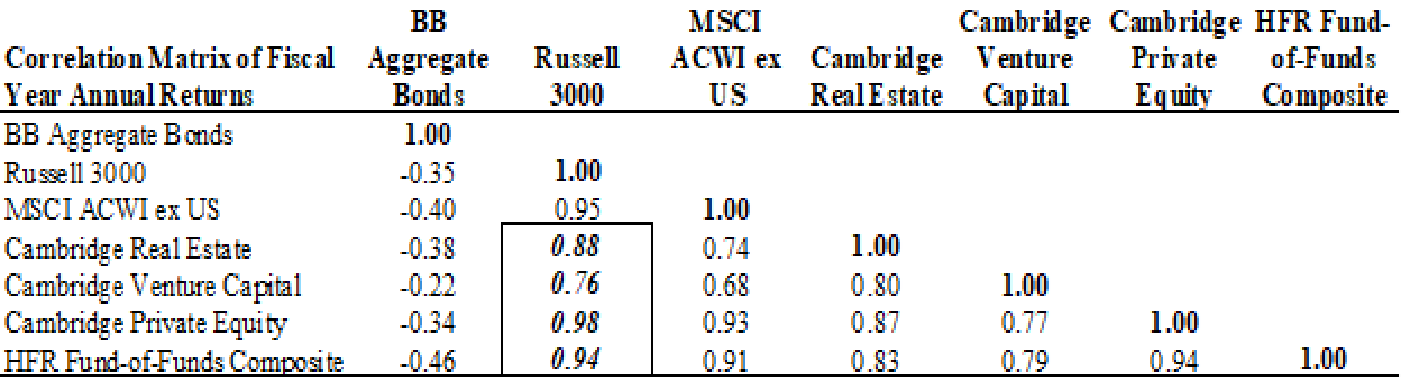
During the Golden Age and in the years following it, alternative markets began evolving dramatically. The impetus was the flood of money that poured into private markets and hedge funds then. For example, between 1995 and 2018 the value of publicly-traded REITs in the U.S. grew 25-fold, from $50 billion to $1.250 trillion.[9] As Pagliari et al. (2003) put it, “...improved market efficiency, increased market capitalization, and better data availability are all contributing to a more seamless real estate market, where public and private market vehicles display a long-run synchronicity....” Hedge fund assets under management increased 27-fold between 1997 and 2018.[10] Private equity assets under management increased 37-fold between 1994 and 2019.[11] As a result, pricing in those markets became better aligned with public-market pricing. Exhibit 5 shows correlation coefficients among principal asset classes beginning in 2009. The average correlation of the four alternative investment categories with U.S. equities is 0.89. (Note the correlation of U.S. stocks and bonds at -0.35.) As alternative investments’ pricing became better aligned with that of public markets, the alternative markets became more efficient, and their returns were subsumed by underlying beta, as elaborated upon in the next section.[12]
Exhibit 5
Correlation Matrix
12 Years Ended June 30, 2020
Performance in the Post-GFC Era
Here we examine the performance of two institutional investor composites beginning June 30, 2008, i.e., during the Post-GFC Era.[13]. One includes 46 large public employee pension funds in the U.S.[14] The other composite is NACUBO’s cohort of approximately 100 endowments with assets greater than $1 billion. Fund returns are represented as being net of all costs. Both composites equal-weight individual funds. We devised a benchmark for each composite using returns-based style analysis with three indexes: Russell 3000 for U.S. stocks, MSCI ACWI ex-U.S. for non-U.S. stocks and Bloomberg Barclays U.S. Aggregate bond index for U.S. investment grade bonds. Both benchmarks are roughly 70% stocks and 30% bonds.[15] We regressed the composites’ returns on their respective benchmark returns for the 12 years ended June 30, 2020, to evaluate their performance in risk-adjusted terms. Exhibit 6 illustrates the results, which are strikingly similar. In fact, we overlay the endowment regression on that of public funds in order to emphasize their near-congruity. Both regressions have a very tight fit, with R2’s of 99% (for public funds) and 98% (for endowments), and standard errors of regression of 1.5% or less. It is worth emphasizing that these are two entirely different sets of institutional actors and investment portfolios. But in terms of their performance footprints, the two are so similar as to be virtually indistinguishable. For example, taking a closer look at Exhibit 6, we can see that 9 of the 12 annual endowment plot points (in orange) are so close to their pension fund mates (in blue) as to at least partially obscure them. In the same vein, at first it may not be clear whether there are two regression lines or a single blurry one. The only meaningful distinction between them is the difference in intercepts (alphas). The endowment alpha of -1.47% exceeds the pension fund alpha of -1.14% by 33 bps. This is the approximate margin of incremental cost incurred by the endowments, and which in turn is attributable to their having an average of nearly 60% invested in pricey alternatives compared with about half as much in the case of the pension funds.
Exhibit 6
Public Fund and Endowment Composite Returns
Versus Stock-Bond Benchmarks
(12 Years Ended June 30, 2020)
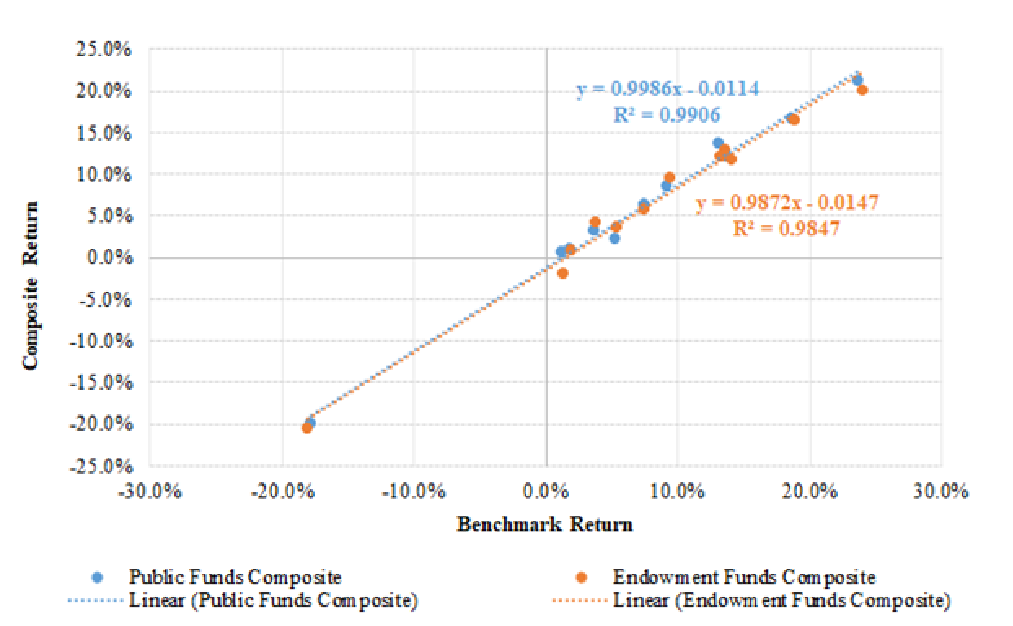
In addition to illustrating the underperformance of the two composites, Exhibit 6 also demonstrates that stock and bond indexes have captured the return-variability characteristics of alternative investments in composites of institutional funds for all intents and purposes. Alternative investments did not have a meaningful impact on their risk-return signature. Rather, alternative investment returns simply blend in with broad market returns in the context of standard portfolio analysis. As a result, the composites earned market returns minus their respective margins of cost.
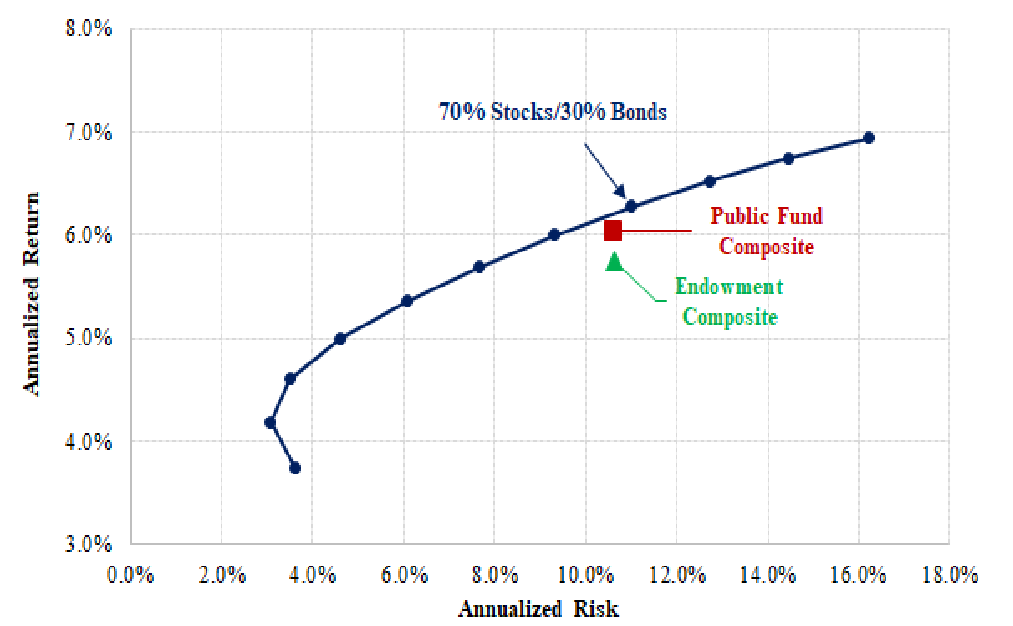
Exhibit 7 illustrates the same result in a slightly different way, namely, using the efficient frontier concept. The frontier itself comprises combinations of passively managed global stocks and investment-grade U.S. bonds.[16] Plotted there as well is the public fund composite and that of large endowments, both of which lie beneath the passive portfolio frontier.[17]
Exhibit 7
Actual Return and Risk
12 Years Ended June 30, 2020
In short, the EM failed to achieve the intended goal of providing superior risk-adjusted performance over the last 12 years. In the next section, we explain the failure.
PROBLEMS WITH THE ENDOWMENT MODEL
Four factors contributed to the failure of the EM.
1. No Diversification Benefit
A fundamental flaw of the EM is that it inappropriately ascribes to alternative investments a diversification benefit like that of combining stocks and bonds. Exhibit 6 shows that alternative investments played no discernible role in the diversification of institutional portfolios in the post-GFC era. Their return variability was explained by stocks and bonds alone for all intents and purposes. In fact, we find evidence that the basic risk-return signature of endowments in the post-GFC period as shown in Exhibit 6 is quite similar to that of the preceding era, the Golden Age of Alternative Investments. An implication of this is that there may never have been a meaningful diversification benefit associated with alternative investments. See Appendix for particulars.
2. No Alpha Contribution from Alternative Investments
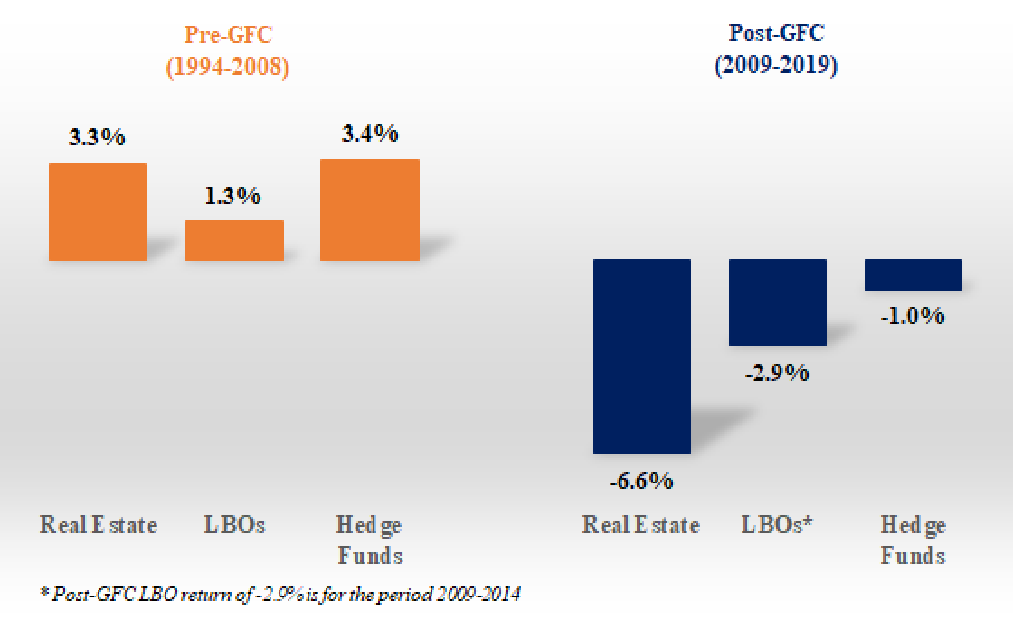
During the Golden Age of Alternative Investments (FYs 1994-2008), eye-popping alphas were mistaken, in part, at least, for a diversification benefit like that of stocks and bonds in combination. Alternatives’ great run as active investments came to an end at about the time of the GFC, which may have played a part in ending the string of exceptional gains to alternative investing. Exhibit 8 shows the excess return of real estate, buyouts and hedge funds for the 15 years ended June 30, 2008, and for the 11 years that followed, revealing a sharp turnabout in excess return for these alternatives.[18]
Exhibit 8
Excess Annual Return for Three Types of Alternative Investments
Before and After the GFC
3. High Cost Combined with Extensive Diversification
The level of investment expense is another factor contributing to the failure of the EM. As mentioned above, we have estimated the cost of investment for public funds and large endowments at 1-2% of total asset value. At the same time, institutional funds are extensively diversified, having R2’s with the market mostly in the range of .95 to .99+; the great majority of funds have active risk (standard deviation of non-market return, or tracking error) of as little as 1% to 3%. With so little active risk, the cost of investing proved to be an insurmountable hurdle for most investors in their effort to achieve a positive alpha. By way of illustration, assume a pension or endowment fund has an R2 with stock and bond market indexes of 96% and an associated active risk of 2.0%. Assume, also, costs of 1.5% per year. If a portfolio with that degree of diversification incurs costs of 1.5% annually, the likelihood of it underperforming a passive benchmark over a decade is 99%.[19] High cost with extensive diversification is a recipe for failure.
4. Manager Proliferation
Cancelation of Active Bets. According to the NACUBO 2019 Study of Endowments, large endowments had an average of 108 asset managers, commingled funds or partnership interests in 2019.[20] That is up dramatically from an estimated average of 18 in 1994, when the remarkable run of endowment performance was getting underway.[21] Large public pension funds average more than 250 managers, funds or partnerships.[22] As the number increases, the potential for offsetting active bets increases. A hundred or more managed portfolios for a single fund is way too many, resulting in thousands of active bets that tend to cancel one another out.
The Selection Challenge. Selecting active managers is primarily a challenge in choosing well against the odds and not an exercise in diversification. We know that investment opportunities with positive information ratios, net of costs, are not easy to come by. We know that year after year the great majority of active stock and bond portfolios underperform properly constructed benchmarks; we know, too, that winners in those areas tend not to repeat, which makes identifying them in advance all the more difficult. And we also know that we are likely to underperform in private equity unless we choose what will turn out to be, after the fact, top-quartile-performing partnerships, i.e., the winners.[23] In other words, we know it is difficult to win what Charles Ellis, some 45 years ago, dubbed the Loser’s Game.[24]
We must appreciate, too, that people do not make assessments of skill in a vacuum or based on a checklist. Rather, they do it by comparing and ranking performers, whether they be pro athletes, musicians or asset managers. If we are to select more than one skillful actor, i.e., to build out a team or ensemble of skillful actors, we must accept the fact that the second and subsequent choices are likely to possess a lesser degree of perceived skill, even if by an indescribably small margin. That is the nature of the process of choosing among skillful actors. In the context of choosing a team of investment managers, as we move down the ranks of candidates, our degree of confidence that the next choice will also be a winner tends to decline, as it must. Therefore, hiring myriad managers does not ensure them being winners collectively. To the contrary, the law of averages works against us as we seek to expand the stable of active managers.
Summary
Factors underlying failure of the EM include: The funds embrace an unwieldy multi-asset-class diversification architecture that emphasizes expensive alternative investments well beyond their proportionate representation in the funds’ natural opportunity set. The multi-asset-class architecture has afforded no diversification benefit beyond what is achieved with stocks and bonds alone. And the funds typically use more than 100 managers and/or funds and incur costs of 1-2% of asset value annually. With the benefit of this perspective, the poor performance of institutional investors is no surprise.
DISCUSSION
One cannot help but conclude that the great majority of institutional investors in the U.S. underestimate the competitiveness of the markets in which they invest. For decades, as noted, researchers have documented that professional investors underperform passive investment by the full margin of their cost. It may also be the case that the institutions simply fail to appreciate how much they are spending on investment management. CEM Benchmarking reports that large institutional investors underreport their costs by half.[25] In any event, these investors, collectively, have failed to exhibit a sound appreciation of the economics of investing and how to reconcile the need for diversification, limited mispricing opportunities and cost.
We have evaluated the EM using broadly diversified composite returns in order to generalize about its efficacy as institutional investment strategy and found it wanting. Have we overgeneralized? Are we saying that no institutional investors adhering to the EM succeeded in adding value? No, we are not. Rather, we are saying that there are strong indications that the EM — as strategy and as practiced today by institutional investors in the main — virtually precludes the production of value added. Is there evidence that individual funds have been successful using some form of the EM? In Ennis (2020, 2021) we examined the performance of a large sample of individual public pension funds and endowments. Just 1 of 46 large public pension funds studied had a statistically significant positive alpha for the decade ended June 30, 2018, while 17 had statistically significant negative alphas. (The sole winner, as it happened, had no alternative investments and an extremely low cost of operation; in other words, it did not utilize the EM.) Of 43 large endowment funds studied through FY 2019, none had a statistically significant positive alpha while 11 had statistically significant negative ones. In other words, we find no evidence that skillful implementation of the EM on the part of individual funds was sufficient to overcome the drawbacks of the strategy.
Do we deny that skill, as the term is commonly used in the context of investing, even exists? No, we do not. We admit the existence of market imperfections and the possibility of skill in exploiting them. And we can only surmise that, where skill exists, it would flourish if freed from the shackles of the EM. How can institutions free themselves to exploit the skill they can employ? They can abandon their rigid asset-class silos and relieve themselves of the obligation to fill them ritualistically. They should not feel obliged to invest heavily in extremely costly alternative investments simply because it is de rigueur to do so. They would have to dramatically reduce the number of managers they use. And it would not hurt if they would exhibit a willingness to allow assets to move freely and in both directions between a passive core and investment opportunities, contingent on the availability of the latter.
Our acknowledgement of the existence of skill notwithstanding, the outlook for public pension funds that stay with the EM is bleak. These are jumbo-sized investors operating in a public and often politically-charged environment. Red tape is great, compensation not so much. There is a pronounced, culturally-based emphasis on diversification, with fully half of large funds exhibiting an R2 with market indexes of nearly 99% and most using literally hundreds of managers. It is important for any competitor, and public funds are competitors, to be sure, to understand their comparative strengths and weaknesses. It is time for public funds to recognize this and to begin playing away from their weaknesses and adopt large-scale passive investment strategies.
Large endowments’ plunge into alternative investments during the Golden Age was a bold move that paid off handsomely. More generally, large endowments are not as prone to the extreme diversification that characterizes public pension funds. For the past 12 years, however, their heavy reliance on largely unproductive alternative investments has been a drag on performance.[26] Not only have endowments underperformed, they have done so with striking consistency. If they stand pat, they risk suffering continuing underperformance of 1-2% per year. Is there reason to believe that alternative assets, in general, will spring back to life as generators of outsized alpha? What might bring this about? Alternatively, are endowment managers capable of a different kind of bold action going forward? If so, what might that be?
CONCLUSION
Institutional investors in the U.S. underestimate the competitiveness of the investment markets in which they participate. They may also fail to appreciate fully the cost of their investment activity. They follow counterproductive diversification and manager-retention practices. As a result, they underperform passive investment alternatives by the full margin of their cost, which is 1-2% of asset value annually. The vast majority of institutional investors would be better off managing their funds passively at next to no cost in the configuration that best accords with their risk tolerance and other preferences.
ACKNOWLEDGEMENTS
The author gratefully acknowledges the helpful comments of Anonymous, Peng Chen, Bruce Jacobs, Michael Karris, Jack Meyer, Stephen Sexauer, William Sharpe, Larry Siegel, Yves Smith and Barton Waring.
REFERENCES
Asness, Clifford. 2018. “The Hedgie in Winter.” https://images.aqr.com/-/media/AQR/Documents/Insights/Perspectives/Cliffs-Perspective-05302018.pdf
Ellis, Charles D. 1975. “The Loser’s Game.” Financial Analysts Journal, Volume 31, Issue 4, pp. 19-26.
Ennis, Richard M. 2020. “Institutional Investment Strategy and Manager Choice: A Critique.” Journal of Portfolio Management (Fund Manager Selection Issue): 104-117.
Ennis, ______. 2021. “Endowment Performance.” Journal of Investing, forthcoming.
Fragkiskos, A., Sean Ryan and Michael Markov. 2018. "Alpha and Performance Efficiency of Ivy League Endowments: Evidence from Dynamic Exposures." Alternative Investment Analyst Review, Vol 7, Issue 2.
Groenendijk, Patrick and Robert Gyorgy. 2015. “How Many Managers Should You Use?” Northern Trust: https://www.northerntrust.com/documents/white-papers/asset-management/how-many-managers.pdf.
Johnson, Eric T. 2017. “Policy Benchmark Selection, Volume II: Approach to Selecting a Risk Premium.” Institutional Limited Partners Association.
L’Her, Jean-Francois, Rossita Stoyanova, Kathryn Shaw, William Scott and Charissa Lai. 2016. “A Bottom-Up Approach to the Risk-Adjusted Performance of the Buyout Fund Market.” Financial Analysts Journal, Volume 72, Issue 4 (July/August), pp. 36-48.
McKinsey & Co. 2017. “Equity Investments in Unlisted Companies: Report for the Norwegian Ministry of Finance, November.
Pagliari, Joseph L., Kevin A Scherer and. Richard T. Monopolies. 2003. “Public versus Private Real Estate Equities.” The Journal of Portfolio Management: Special Real Estate Issue, 29 (5) 101-111.
Phalippou, L., and O. Gottschalg. 2009. “The Performance of Private Equity Funds.” The Review of Financial Studies 22 (4): 1747-1776.
Ritter, Jay R. 2020. “Initial Public Offerings: Updated Statistics.” https://site.warrington.ufl.edu/ritter/files/IPOs2019Statistics.pdf
Sharpe, W. F. 1988. “Determining a Fund’s Effective Asset Mix.” Investment Management Review (September/October): 16–29.
Sharpe ______. 1992. “Asset Allocation: Management Style and Performance Measurement.” Journal of Portfolio Management Winter: 7-19.
Sullivan, Rodney N. 2021. “Hedge Fund Alpha: Cycle or Sunset?” Forthcoming, The Journal of Alternative Investing, forthcoming.
APPENDIX: DID ALTERNATIVES EVER CONFER A DIVERSIFICATION BENEFIT?
We find evidence that the post-GFC Era was not really any different from the two eras that preceded it in terms of the diversification pattern exhibited by the endowments. Exhibit A.1 provides some insight. During the first era, returns for the composite had an R2 with its stock and bond benchmark of 97% and a standard error of the regression of 2.2%. This tight fit is logical on its face owing to the extensive diversification of the composite and the fact that it comprised stocks and bonds nearly exclusively throughout that era. The correlation of the composite and its stock-bond benchmark is much lower in the second era, with an R2 of just 78% and more than a doubling of the standard error of the regression to 4.7%. During the final era, notwithstanding a greater-than-50% allocation to alternative investments (and making no adjustment for alternative investments’ return smoothing), the composite had an R2 of 98% and standard error of just 1.4%, indicating that alternatives did not play a role in the diversification pattern of the endowments, as discussed in the body of the paper.
Exhibit A.1
Regression Statistics for Three Eras of Endowment Returns
|
|
|
|
|
|
|
|
Average Allocation To Alts |
Average Excess Return |
R2 |
Standard Error of Regression |
|
Stocks and Bond Era |
<10% |
-0.8% |
.97 |
2.2% |
|
Golden Age of Alternatives |
34 |
+4.1 |
.78 |
4.7 |
|
Post-GFC Era |
54 |
-1.6 |
.98 |
1.4 |
|
|
|
|
|
|
|
Golden Age ex-FY 2000 |
34 |
+2.8 |
.96 |
1.8 |
The Golden Age stands out for its exceptional excess return and comparatively large measure of non-market risk. The latter might well be taken as an indication that other factors, such as “uncorrelated” returns of alternative investments, played an important role in defining the diversification pattern of endowments during that era. But that is not necessarily the case.
Fiscal year 2000 was a most extraordinary year for the large endowments. Their total return in that year was 29.2% according to NACUBO. That far outstripped returns of U.S. stocks (9.6%), non-U.S. stocks (18.1%) and bonds (4.6%). The equivalent-risk passive benchmark returned 10.2% in FY 2000, which means the endowment composite had a stunning risk-adjusted return of +19.0% as shown in Exhibit 4. During FY 2000 hedge funds returned a handsome +20% total return. Buyouts generated an exceptional +38%. And venture capital produced a sizzling +220%. Apropos the latter, first-day IPO returns during the calendar years 1999 and 2000, the height of the dot-com IPO bubble, averaged +64.6% compared with an average of +17.9% for the entire 1980-2019 period.[27]
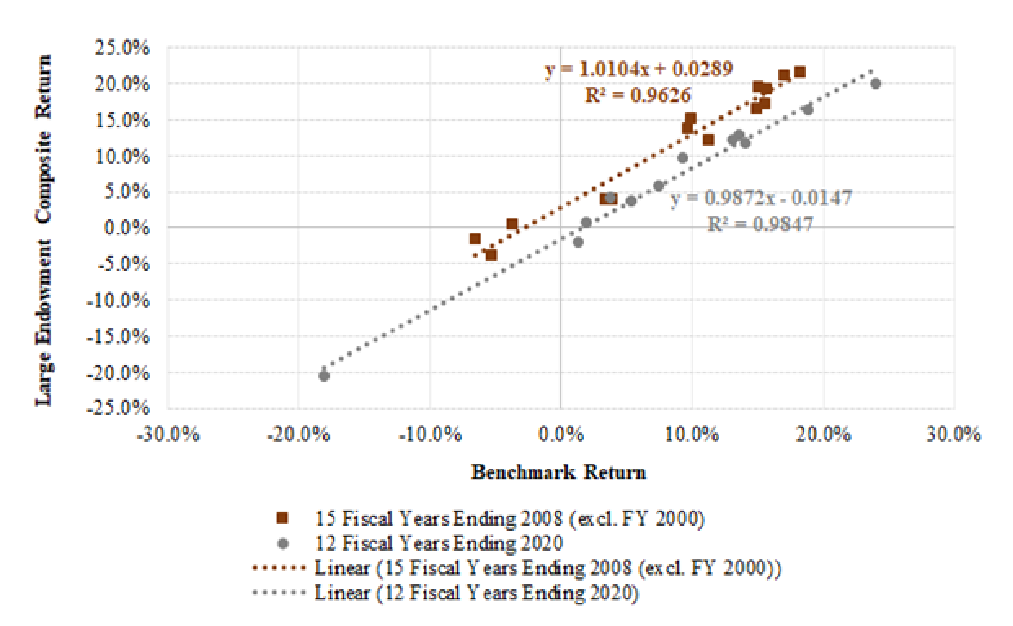
What happens if we exclude the single fiscal year of 2000 from the regression analysis for the Golden Age of Alternative Investments? The bottom row of Exhibit A.1 and Exhibit A.2 illustrate the result. Exhibit A.1 indicates an R2 of that regression is 96% (versus 78% when including FY 2000). The upper regression line of the two shown in Exhibit A.2 pertains to the period in question, FYs 1994-2008 (with the exclusion of FY 2000). The line below it pertains to fiscal years 2009-2020, i.e., the post-GFC era, (the same line shown in Exhibit 6). The R2 for that period is 98%. In other words, stock and bond indexes explain nearly all the return variance of the composite in both eras if we ignore the outlier year of FY 2000. And it was an outlier in statistical terms as well: With a standard error of regression of just 1.8%, the FY 2000 return would fall more than nine standard errors above the regression line in Exhibit A.2. Over the three eras covering 47 years shown in Exhibit A.1 (excluding FY 2000), the R2’s of the large endowment composite were 97%, 96% and 98%, with no attempt to adjust alternative asset returns for smoothing that might exist. Thus, if one views the extraordinary year of FY 2000 as an outlier, then a reasonable interpretation of the history of endowment returns is that alternative investments never did confer a diversification benefit on the endowments.
Exhibit A.2
Regression of Composite Returns on Stock-and-Bond
Benchmarks in Two Eras
(Excluding FY 2000)
[1] Correlation coefficients are calculated as 36-month moving averages over the 44-year period. Stocks are represented by the S&P 500 index and bonds by the Bloomberg Barclays Aggregate bond index.
[2] See Public Plans Data at the Center for Retirement Research, Boston College.
[3] For Large Endowments, “Other” includes commodities, REITs, and short-term securities/other categories. For Opportunity Set, “Other” includes “Growth” and “Other” private equity assets.
[4] Public Fixed Income includes U.S. taxable, investment-grade bonds as represented by the Bloomberg Barclays Aggregate U.S. Bond Index. The composition of the U.S. and non-U.S. Equity components match the respective compositions of the Russell 3000 Stock Index and the MSCI ACWI ex-U.S. Stock Index. All components are market value weighted with the exception of the U.S. and non-U.S. Equity components, which are weighted 2:1 U.S.: non-U.S., to reflect our estimate of the home-county bias observed on the part of U.S. institutions. Sources include NACUBO, SIFMA, McKinsey and BarclayHedge.
[5] See NACUBO 2019 Study of Endowments and Greenwich Associates “U.S. Institutional Market Trends,” (2019.)
[6] See McKinsey & Co. (2017) and Phalippou and Gottschalg (2009).
[7] See Ennis (2020) for discussion of the derivation of the cost estimates.
[8] Ennis (2021) employed the quadratic programming technique originated by Sharpe (1988, 1992) in the design of performance benchmarks, using three indexes: Russell 3000 for U.S. stocks, MSCI ACWI ex-U.S. for non-U.S. stocks and Bloomberg Barclays U.S. Aggregate bond index for U.S. investment grade bonds. Popularly known as returns-based style analysis (RBSA), the technique enables the analyst to determine which indexes statistically explain the risk-return characteristics of a portfolio, or composite of them as in the present case. The analyst can introduce, i.e., make available, two or more index return series as independent variables to determine the allocation among the indexes that best matches the composite in terms of its risk-return signature. It leads to the identification of passively-investable benchmarks that have the best statistical fit with the return series under examination. See Fragkiskos et al. (2018) for an earlier application of the RBSA to endowments.
[9] See FTSE NAREIT Real Estate Index Historical Market Capitalization, 1972 - 2018 (NAREIT) and REIT Industry Monthly Data for December 2019 (NAREIT 2019).
[10] Hedge fund assets under management in 1997 totaled approximately $118 billion. The figure grew twenty-seven-fold to $3.2 trillion in 2018 with much of the influx occurring in a handful of years leading up to the Great Financial Crisis. Source: HFR (2019).
[11] Private equity assets under management of $100 billion in 1994 grew thirty-seven-fold to $3.7 trillion in 2019. Sources: HFR (2019);; Federal Reserve Bank of Dallas, December 1995.
[12] See Ennis (2020) for a fuller discussion of the evolution of alternative investment markets over two decades.
[13] June 30 fiscal years are most common among endowments and public pension funds.
[14] See Ennis (2020) for details of the construction of the public fund composite.
[15] The public fund benchmark is 53% U.S. equities, 17% non-U.S. equities and 30% bonds. The endowment benchmark is 56% U.S. stocks, 16% non-U.S. stocks and 28% bonds.
[16] As with the opportunity set, the proportion of U.S. stocks to non-U.S. is two to one.
[17] Ennis (2020 and 2021) are comprehensive empirical studies of the performance of public pension funds and large endowments in the U.S. They provide further evidence of significant underperformance on the part of these institutional investors post-GFC.
[18] For real estate, we subtract the returns of the FTSE NAREIT All-Equity REIT Index from those of the Cambridge Associates Real Estate Index, using quarterly IRRs to estimate TWRs for the Cambridge series. For buyout funds these are the average excess returns reported by L’Her et al. (2016) in Tables 3 and 4 for size-, leverage- and sector-adjusted returns. The hedge fund excess returns are as reported by Sullivan (2020).
[19] The probability reflects the area under a normal distribution curve with a tracking error of 2.0% and incorporating a cost of 1.5% per year.
[20] Ambiguity is inherent in the term “investment manager,” at least in the reporting of the hiring practices of institutional investors. What matters in the present context is the total number of independently-managed portfolios, commingled funds or limited partnerships employed, and not the number of manager organizations, or “managers,” doing business with a particular investor. For example, funds of funds, as in the case of hedge funds and private equity, are typically counted as a single manager, which under-represents the total number of individual, independently-managed portfolios being invested in. Most likely the figures here are biased downward in terms of the total number of individually-managed portfolios utilized.
[21] The author estimated the average number of managers for 1994 from the NACUBO Study of that year.
[22] This figure is based on the author’s review of the annual reports of 46 of the largest public pension funds. Nine funds did not report on the number of managers, leaving 37 that did. Those 37 indicated an average of 252 separately managed portfolios. Several funds, however, reported only on the number of managers in one or more segments of their portfolios, e.g., private equity. It is safe to say, therefore, that the overall average of the 37 funds exceeds 250.
[23] See Johnson (2017), Exhibit 14.
[24] Ellis (1975) described the chronic underperformance of professional investors that persists to today.
[25] https://www.top1000funds.com/2020/11/asset-owners-report-half-of-all-costs/
[26] See Ennis (2021) for evidence of the adverse impact of alternative investments on endowment performance.
[27] See Ritter (2020).

