Endowment Performance
Ennis (2020) examined the performance of educational endowments and public pension funds in the U.S. over the decade ended June 30, 2018. A composite of endowments underperformed a passive benchmark by an average of 1.6% per year. A composite of public pension funds underperformed by 1.0%. These figures approximate the investors’ respective margins of cost, which were estimated independently of rate of return data. This paper provides further insight into the performance of educational endowment funds. It extends their return history back to 1974 and updates returns through June 30, 2020.[1] Additionally, using a novel dataset of returns for individual endowments, it analyzes returns in cross section. The paper attempts to disentangle the performance effects of (1) equity exposure, (2) portfolio size, (3) degree of reliance on alternative investments, and (4) style tilts. Like the prior work, this paper underscores the fact that diversification with high cost is a recipe for failure.
PRIOR RESEARCH
Hammond (2020) is a pioneering effort to document the long-term performance of educational endowments in the U.S. Using NACUBO archival data back to FY 1962, it determines that over the 58 years ended June 30, 2019, the average endowment earned 8.1% per year net of fees, compared with 9.1% for a 60/40 passive benchmark, for a shortfall of 1.0% per year[2]. Exhibit 1 shows that the 60/40 portfolio outperformed the average endowment in four out of five decades, the decade ended 2009 being the sole exception. The average endowment enjoyed an advantage of 250 bps in that decade, which was followed by one in which it underperformed “60/40” by 210 bps per year.
Exhibit 1
Annualized Rates of Return (%)
|
Decade Ending 6/30 |
Large Cohort |
Average Endowment |
Small Cohort |
60/40 Passive |
|
2019 |
9.0 |
8.4 |
7.7 |
10.5 |
|
2009 |
6.1 |
4.0 |
3.9 |
1.5 |
|
1999 |
14.0 |
12.9 |
12.3 |
14.6 |
|
1989 |
15.0 |
13.7 |
12.7 |
14.8 |
|
1979 |
4.6 |
4.5 |
4.5 |
5.6 |
Source: Hammond (2020)
RISK-ADJUSTED PERFORMANCE: FYs 1974-2020
Our approach differs from Hammond (2020) in the following ways. First, we use returns-based style analysis to better calibrate performance benchmarks with effective market exposures in order to adjust returns for risk. Second, our dataset dates to the beginning of the availability of fiscal year annual returns from NACUBO, which is FY 1974[3]. Third, we differentiate sub-periods (or eras) not by decade or other fixed time period but in terms of distinctive risk-return characteristics during the 47-year study period ending FY 2020. Finally, our research is primarily concerned with the performance of large endowments, which are the subject of analysis unless otherwise noted[4].
We employ the quadratic programming technique originated by Sharpe (1988, 1992) in the design of performance benchmarks. Popularly known as returns-based style analysis, the technique enables the analyst to determine which indexes statistically explain the risk-return characteristics of a portfolio, or composite of them as in the present case. The analyst can introduce, i.e., make available, two or more index return series as independent variables to determine the allocation among the indexes that best matches the composite in terms of its risk-return signature. It leads to the identification of passively-investable benchmarks that have the best statistical fit with the return series under examination. See Fragkiskos et al. (2018) for an earlier application of the methodology to endowments.
Three Eras
Our analysis of the long-term NACUBO return series led us to identify three distinct eras of endowment management and performance. We refer to them as:
- Stock and Bond Era (FY 1974 to FY 1993)
- Golden Age of Alternative Investments (FY 1994 to FY 2008)
- Post-GFC Era (FY 2009 to FY 2020)
During the first era, endowments’ equity investments were predominantly domestic common stock; bonds were strictly investment grade. Exhibit 2 illustrates that alternative investments did not play an important part in endowments’ asset allocation until the early 1990s. Alternative investments averaged 34% of endowment assets during the second era and 54% at its end. Real estate, venture capital and buyouts, in particular, experienced exceptionally strong returns during the second era. (See Exhibit 3.) The third era represents a fundamental shift in endowment performance that occurred about the time of the Global Financial Crisis of 2008, and which we explore in detail.
Exhibit 2
Allocation to Alternatives over Time (Dollar-Weighted Means)
|
1986 |
1990 |
1994 |
1998 |
2002 |
2004 |
2008 |
2019 |
|
|
Hedge Funds |
2.4% |
6.2% |
14.7% |
17.9% |
23.1% |
20.5% |
||
|
Distressed Securities and Event Arbitrage |
0.1% |
2.1% |
2.4% |
|||||
|
Real Estate |
2.3% |
4.4% |
4.2% |
6.9% |
5.9% |
5.0% |
7.5% |
6.5% |
|
Venture Capital |
3.7% |
4.5% |
4.4% |
4.7% |
4.4% |
4.0% |
9.0% |
|
|
Leveraged Buyouts |
1.4% |
2.1% |
3.8% |
4.2% |
4.2% |
10.1% |
13.6% |
|
|
Natural Resources |
1.1% |
1.1% |
0.9% |
1.9% |
2.5% |
6.5% |
6.0% |
|
|
Other |
1.6% |
1.3% |
1.5% |
2.0% |
2.2% |
3.2% |
2.3% |
2.4% |
|
Total Alternatives |
4% |
12% |
18% |
27% |
34% |
37% |
54% |
58% |
Source: NACUBO
Exhibit 3
Asset Class Performance During the Golden Age
of Alternative Investments
|
Asset Class |
Total Annual Return (Percent) |
|
U.S. Bonds |
6.1 |
|
U.S. Stocks |
9.3 |
|
Non-U.S. Stocks |
8.2 |
|
Real Estate |
14.2 |
|
Venture Capital |
19.2 |
|
Buyouts |
17.5 |
|
Hedge Funds |
8.0 |
Benchmarks and Performance
Benchmarks. Exhibit 4 summarizes benchmark weights derived by means of returns-based style analysis and the average annual excess return[5] for the three eras. Columns 2 through 4 of Exhibit 4 indicate the benchmark weights of three public market indexes: Bloomberg Barclays U.S. Aggregate bonds, Russell 3000 stocks and MSCI ACWI ex-U.S stocks. They show how the effective exposures evolved over time. The fifth column shows that total effective equity exposure rose from 56% during the first era to 72% during the third. (We emphasize that these are not average allocations that existed during the era; rather they are indications of the effective exposures to three public market indexes for each era as a whole, derived via returns-based style analysis.)[6]
Exhibit 4
Benchmark Weights and Excess Return
|
Era |
U.S. Bonds |
U.S. Equities |
Non-U.S. Equities |
Total Equity |
Average Annual Excess Return |
|
1. Stocks & Bonds |
44% |
50% |
6% |
56% |
-0.8% |
|
2. Golden Age |
36 |
35 |
28 |
64 |
+4.1 |
|
3. Post-GFC |
28 |
56 |
16 |
72 |
-1.6 |
Performance. During the first era, with an average annual excess return of -0.8%, endowments underperformed by the approximate margin of their investment expense. During the second era, endowments had extraordinary results (an average annual excess return of +4.1%), which is largely attributable to the three areas of alternative investment noted above. Although allocations to those areas of alternative investment were little changed in the years following the Golden Age, performance during the third era experienced a sharp turnabout, with an average annual excess return of -1.6% per year. This is also approximately equal to the margin of investment expense, reflecting the heavy reliance on pricey alternative investments during the third era.[7]
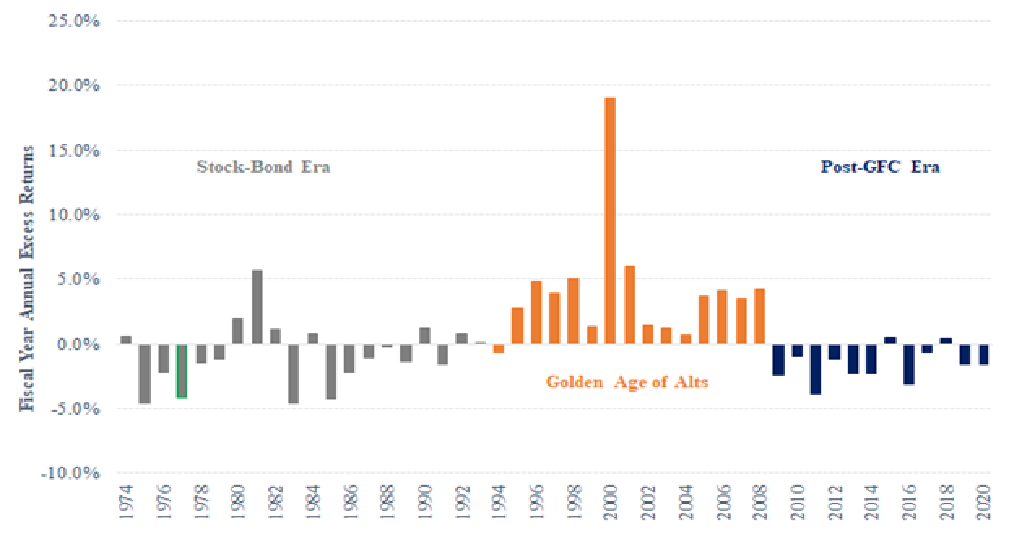
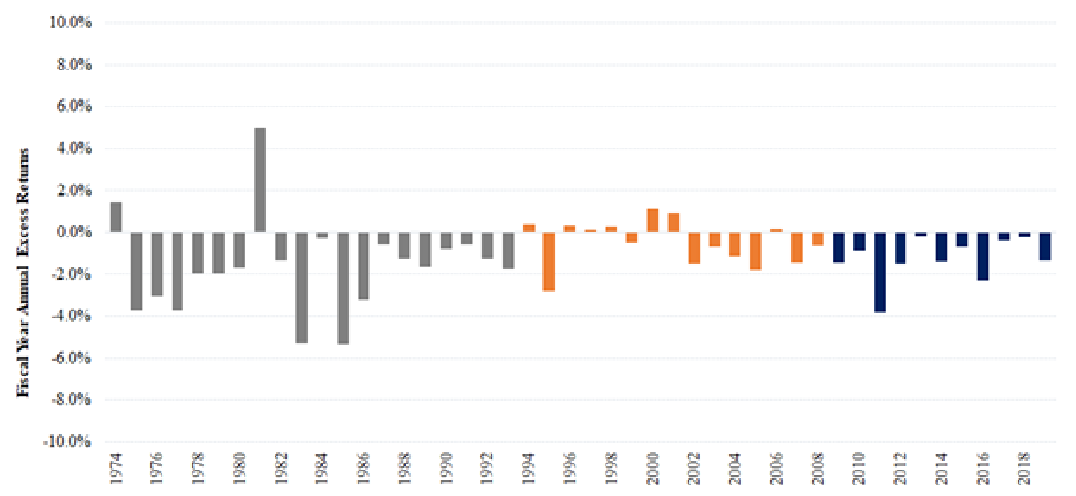
Exhibit 5 presents the three eras of endowment performance graphically. There is nothing noteworthy about the first era. The endowments, which comprised mainly domestic stocks and bonds, underperformed passive investment by the approximate margin of cost on average, with some up years and some down. The extraordinary excess returns of the second era are what garnered U.S. endowments notoriety. The most interesting era at this juncture, however, is the final one, the Post-GFC Era. Here we see an abrupt turnabout in performance from the Golden Age, and the consistency of underperformance in the Post-GFC Era is noteworthy as well. Gaining insight into this reversal of fortune is a principal focus of the analysis that follows.
Exhibit 5
47 Years of Excess Return for Large NACUBO Endowments
THE MODERN-DAY ENDOWMENT MANAGEMENT STYLE
We have become accustomed to hearing and reading of the endowment model. There is, in fact, no canonical model for managing endowment funds. There are, however, certain recurring themes often associated with their management. We refer to these themes a bit more modestly as elements of endowment-management style. They include:
- Active Management. The ability to identify and exploit investment skill is an overarching theme among endowment managers. Large endowments use an average of 108 managers and invest only 6% of their assets passively.[8] Their willingness to pay for perceived skill is exemplified by their large commitments to pricey hedge funds and private equity.
- Equity Orientation. A long-standing endowment tradition is that equity investments, broadly speaking, should be the predominant portfolio holding. That said, equity exposure varies among institutions, largely based on the size of their portfolios. Large funds maintain an average effective equity exposure of 72%, with figures of 80% or more not uncommon. Small funds average 63% (particulars follow).
- Private Markets. Private markets are a central focus of many endowment managers and their advisors. They are viewed as riper for exploitation by skillful investors as well as being a source of diversification. Along with hedge funds, private investments form the core of what are commonly known as alternative investments, or “alts.” Large endowments avail themselves of private market opportunities and other alternatives to a greater extent than do the small ones.
- Value Over Growth. Some observers believe there is, or at least has been in the not-so-distant past, a bias in favor of value stocks over growth on the part of many endowments. Any such bias may have lessened as a result of the underperformance of value relative to growth during the last decade or so.
The endowment style of investing produced superior results in the 1990s and early years of this century, so much so that it became a subject of enduring interest among investors around the world.
PERFORMANCE POST-GFC
Performance by Size Cohort
We compare the performance of six endowment fund cohorts (774 funds in total) defined by dollar value of investment portfolio.[9] Exhibit 6 provides key statistics for the cohorts. Note the wide range of practice in terms of the use of alternative investments (as defined by NACUBO), from 7% of assets for the smallest cohort to 51% for the largest. Exhibit 7 summarizes the benchmarks used and performance results. The start date for the analysis is July 1, 2008. We use returns-based style analysis to establish portfolio benchmarks.[10] Then we regressed cohort returns on their respective benchmarks to derive risk-adjusted returns, as reported in Exhibit 7. The benchmarks fit the returns well, with R2s that round to .99 and (small) standard error terms ranging from 0.8% to 1.5%. The effective (derived) total equity allocations are reasonable on their face, ranging from 63% to 72%. Risk-adjusted returns (alphas) for the various cohorts fall within a range of -1.1% to -1.8%, with t-statistics of -2.7 to -4.9. These results are consistent with the findings of Ennis (2020). A key takeaway from Exhibit 7 is that risk-adjusted performance of endowments is consistent across cohorts of fund size, i.e., there is no evidence that larger funds do better than smaller ones after adjusting for risk.[11]
Exhibit 6
NACUBO Size Cohorts
|
NACUBO Size Cohort |
Number of Funds |
Median Asset Value (Millions) |
Average Allocation to Alternatives[12] |
11-Year Return[13] |
|
1. <$25 M |
60 |
$17 |
7% |
5.58% |
|
2. $25-50 M |
93 |
37 |
15 |
5.32 |
|
3. $51-100M |
152 |
74 |
21 |
5.21 |
|
4. $101-500M |
280 |
350 |
29 |
5.25 |
|
5. $501M to $1B |
82 |
730 |
38 |
5.47 |
|
6. >$1 B |
107 |
1,987 |
51 |
5.94 |
Exhibit 7
Benchmark Weights and Performance Statistics of
Endowments by Size Cohort for the Eleven Years Ended June 30, 2019
|
Cohort |
Derived Exposure (%) |
Regression Statistics |
||||||
|
Bonds |
U.S. Equity |
Non-U.S. Equity |
Total Equity |
R2 |
Standard Error (%) |
Alpha (%) |
Alpha t-Stat |
|
|
37 |
44 |
19 |
63 |
.988 |
1.1 |
-1.14 |
-2.7 |
|
2 |
33 |
46 |
21 |
67 |
.994 |
0.8 |
-1.52 |
-4.9 |
|
3 |
33 |
45 |
22 |
67 |
.993 |
0.9 |
-1.49 |
-4.3 |
|
4 |
30 |
49 |
21 |
70 |
.991 |
1.1 |
-1.69 |
-4.2 |
|
5 |
30 |
54 |
16 |
70 |
.985 |
1.4 |
-1.81 |
-3.5 |
|
6. Largest |
28 |
56 |
16 |
72 |
.985 |
1.5 |
-1.46 |
-2.7 |
A Limited Value Effect
We test for the presence and possible effect of a value-stock bias, or value tilt. To do so, we introduced an additional independent variable in the returns-based style analysis to represent the value factor.[14] Exhibit 8 presents results of the analysis. There is indeed an identifiable value effect evident in the data, and it is most pronounced in the smaller fund-size cohorts. In Cohort 1 (smallest), for example, 47 bps of 126 bps of negative excess return is associated with introduction of the value factor. The effect diminishes as fund size increases and disappears entirely for the cohort comprising the largest funds (#6). The intuition for this may be that funds in Cohort 1 have 46% of their assets, on average, in domestic common stocks, whereas Cohort 6 funds average just 11%. In other words, there simply may have been greater opportunity for a value-stock bias to manifest itself among the smaller funds, which also lack the resources and asset size for all-out investing in alternative assets. It may also be the case that smaller funds simply concentrated their value holdings to a greater extent than did the larger ones. Data limitations did not allow us to explore this possibility.
Exhibit 8
Breakdown of Excess Return Between Value Tilt and Other Sources
for the Eleven Years Ended June 30, 2019
|
|
|
|
Excess Return |
||
|
Cohort |
Composite Return |
Benchmark Return |
Total |
Due to Value Bet |
Due to Other Bets & Costs |
|
1. Smallest |
5.58% |
6.85% |
-1.26% |
-0.47% |
-0.79% |
|
2. |
5.32 |
6.90 |
-1.58 |
-0.17 |
-1.41 |
|
3. |
5.21 |
6.79 |
-1.58 |
-0.23 |
-1.35 |
|
4. |
5.25 |
7.03 |
-1.78 |
-0.15 |
-1.63 |
|
5. |
5.47 |
7.42 |
-1.94 |
-0.13 |
-1.82 |
|
6. Largest |
5.94 |
7.52 |
-1.58 |
0.00 |
-1.58 |
Cross-Sectional Analysis of Individual Funds
We created a dataset of fiscal-year annual returns and percentage allocations to alternative investments for 43 endowment funds with assets greater than $1 billion.[15] We created a benchmark for each individual fund using the same returns-based style analysis methodology used for the cohort benchmarks. We then regressed individual fund returns on their unique benchmark. Exhibit 9 summarizes key results. The schools are ranked in descending order of alpha. The funds’ alphas range from a high of +2.07% to a low of -3.56%. None of the positive alphas are statistically significant. Eleven of the negative alphas are statistically significant. Note the wide range of effective equity exposure — from 60% (Vanderbilt) to 86% (Carnegie Mellon). Measured diversification (R2) also varies widely — from .835 (MIT) to .995 (Missouri). Pronounced underperformance is evident across the range of both equity exposure and diversification. With just 11 years of return history, we were unable to investigate whether there may have existed persistence of alpha among the endowments. This would be a useful avenue to explore in future research.
Exhibit 9
Diversification and Performance of Large Endowment Funds
for the Eleven Years Ended June 30, 2019
|
Rank |
Educational Institution |
Effective Equity Exposure |
R2 |
Alpha |
t-stat |
|
1 |
Massachusetts Institute of Technology |
64% |
0.835 |
2.07% |
1.25 |
|
2 |
Bowdoin College |
71% |
0.870 |
2.03% |
1.26 |
|
3 |
Michigan State University |
69% |
0.969 |
1.39% |
1.94 |
|
4 |
Williams College |
71% |
0.931 |
0.99% |
0.86 |
|
5 |
University of Pennsylvania |
67% |
0.941 |
0.73% |
0.73 |
|
6 |
Columbia University |
68% |
0.953 |
0.56% |
0.60 |
|
7 |
University of California |
69% |
0.957 |
0.32% |
0.36 |
|
8 |
University of Richmond |
63% |
0.937 |
0.29% |
0.30 |
|
9 |
Dartmouth College |
70% |
0.917 |
0.25% |
0.20 |
|
10 |
Princeton University |
77% |
0.910 |
0.23% |
0.16 |
|
11 |
Rice University |
71% |
0.978 |
0.18% |
0.29 |
|
12 |
University of Missouri |
68% |
0.995 |
0.01% |
0.05 |
|
13 |
University of Virginia |
76% |
0.966 |
-0.01% |
-0.02 |
|
14 |
University of Notre Dame |
73% |
0.955 |
-0.12% |
-0.13 |
|
15 |
Rutgers University |
62% |
0.975 |
-0.18% |
-0.31 |
|
16 |
Yale University |
77% |
0.902 |
-0.21% |
-0.14 |
|
17 |
Wellesley College |
69% |
0.967 |
-0.22% |
-0.29 |
|
18 |
Northwestern University |
62% |
0.940 |
-0.42% |
-0.44 |
|
19 |
Brown University |
74% |
0.919 |
-0.87% |
-0.66 |
|
20 |
Pennsylvania State University |
72% |
0.987 |
-0.92% |
-1.75 |
|
21 |
University of Rochester |
70% |
0.956 |
-0.97% |
-1.05 |
|
22 |
Amherst College |
74% |
0.952 |
-1.06% |
-1.07 |
|
23 |
North Carolina State University |
71% |
0.888 |
-1.18% |
-0.79 |
|
24 |
Stanford University |
78% |
0.969 |
-1.19% |
-1.40 |
|
25 |
Vanderbilt University |
60% |
0.875 |
-1.24% |
-0.93 |
|
26 |
Purdue University |
74% |
0.990 |
-1.25% |
-2.75 |
|
27 |
University of Chicago |
64% |
0.872 |
-1.38% |
-0.85 |
|
28 |
Duke University |
84% |
0.985 |
-1.42% |
-2.23 |
|
29 |
Washington University in St. Louis |
71% |
0.969 |
-1.47% |
-1.87 |
|
30 |
UCLA Foundation |
74% |
0.919 |
-1.56% |
-1.22 |
|
31 |
University of Michigan |
80% |
0.989 |
-1.59% |
-3.16 |
|
32 |
University of Pittsburgh |
76% |
0.987 |
-1.76% |
-3.25 |
|
33 |
University of Washington |
74% |
0.936 |
-1.82% |
-1.58 |
|
34 |
Carnegie Mellon University |
86% |
0.964 |
-1.84% |
-1.80 |
|
35 |
Case Western University |
69% |
0.964 |
-1.88% |
-2.35 |
|
36 |
University of North Carolina |
75% |
0.870 |
-2.00% |
-1.18 |
|
37 |
University of Southern California |
78% |
0.990 |
-2.11% |
-4.34 |
|
38 |
Tulane University |
78% |
0.936 |
-2.16% |
-1.79 |
|
39 |
University of Georgia |
80% |
0.992 |
-2.67% |
-6.25 |
|
40 |
Ohio State University |
74% |
0.934 |
-2.82% |
-2.34 |
|
41 |
Cornell University |
80% |
0.972 |
-2.93% |
-3.57 |
|
42 |
Harvard University |
80% |
0.956 |
-3.13% |
-2.99 |
|
43 |
Southern Methodist University |
72% |
0.900 |
-3.56% |
-2.54 |
|
|
Median |
72% |
0.955 |
-1.06% |
n/a |
Conclusions
- Effective equity exposure is the overwhelming determinant of risk and return, with 99% of return variance explained by stock and bond indexes alone in return composites.
- Fund size is not a determinant of risk-adjusted performance, which is fairly consistent across cohorts of asset size.
- A value bias is evident. It had a negative effect on risk-adjusted performance during the period of this study, mainly among smaller endowments. Even there, it accounts for a minor part of observed underperformance.
The overarching conclusion of this section is that endowment funds have underperformed passive investment by a significant margin during the Post-GFC Era, no matter how one slices the data.
ALTERNATIVE INVESTMENTS
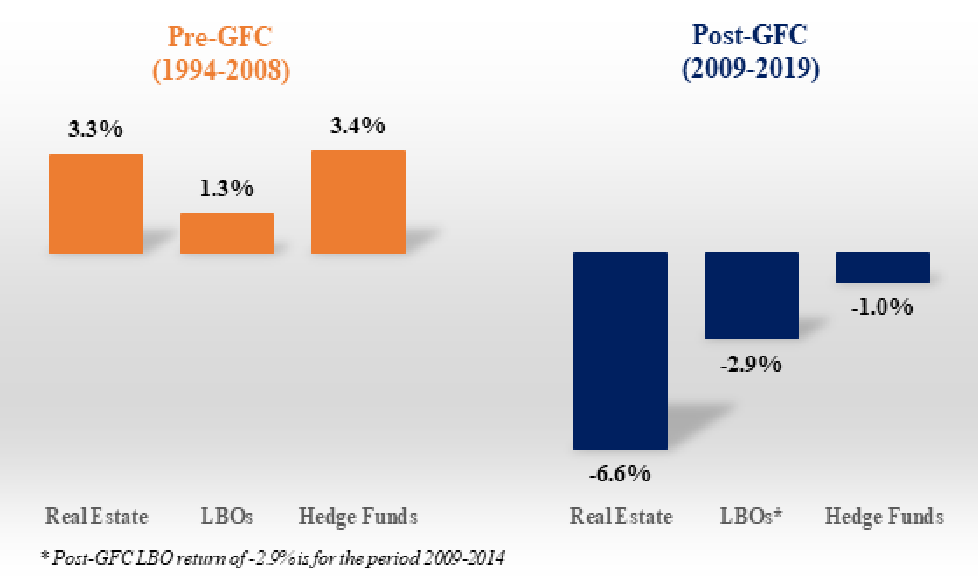
Alternative investments played a prominent a role in determining investors’ fortunes during the heyday of endowment investing, as noted in Exhibit 3. Alternatives also featured in the reversal of fortune of alternative-heavy investors in the wake of the GFC. Exhibit 10 compares excess return for three principal types of alternatives during the Golden Age and in the Post-GFC.[16] What brought about this turnaround?
Exhibit 10
Excess annual Return for Three Types of Alternative Investments
Before and After the GFC
Market Evolution
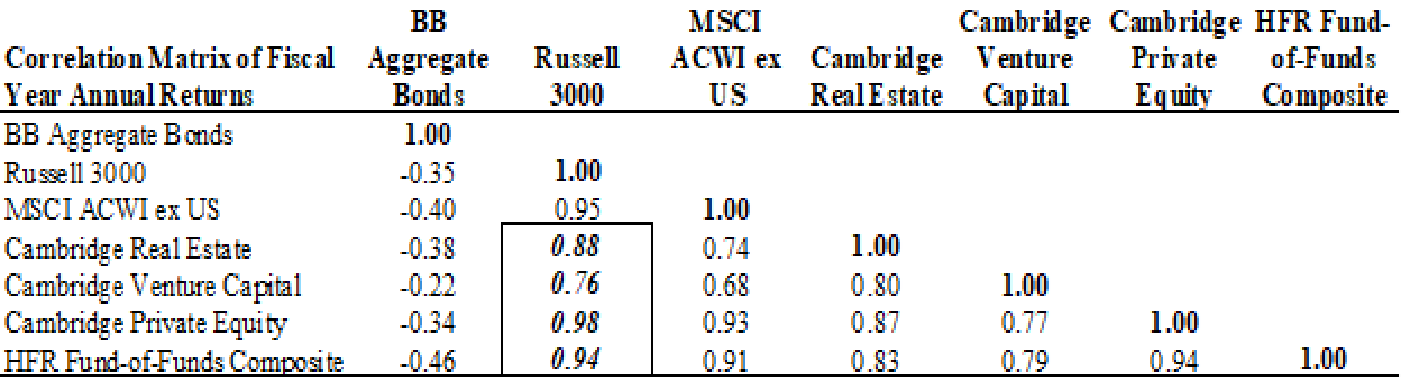
A largely unnoticed phenomenon began playing out in the Golden Age of Alternative Investments and continued doing so in the Post-GFC Era. Namely, the alternative asset markets themselves evolved dramatically. The impetus was the flood of money that poured into private markets and hedge funds. During the Golden Age and in the years following, alternative markets began evolving dramatically. The impetus was the flood of money that poured into private markets and hedge funds then. For example, between 1995 and 2018 the value of publicly-traded REITs in the U.S. grew 25-fold, from $50 billion to $1.250 trillion.[17] As Pagliari et al. (2003) put it, “...improved market efficiency, increased market capitalization, and better data availability are all contributing to a more seamless real estate market, where public and private market vehicles display a long-run synchronicity....” Hedge fund assets under management increased 27-fold between 1997 and 2018.[18] Private equity assets under management increased 37-fold between 1994 and 2019.[19] As a result, pricing in those markets became better aligned with public-market pricing. Exhibit 11 shows correlation coefficients among principal asset classes beginning in 2009. The average correlation of the four alternative investment categories with U.S. equities is 0.89. (Note the correlation of U.S. stocks and bonds at -0.35.) As alternative investments’ pricing became better aligned with that of public equity markets, the alternative markets became more efficient, and their returns were subsumed by underlying beta, as elaborated upon in the next section.[20]
Exhibit 11
Correlation Matrix
12 Years Ended June 30, 2020
Alternative Investments and Diversification
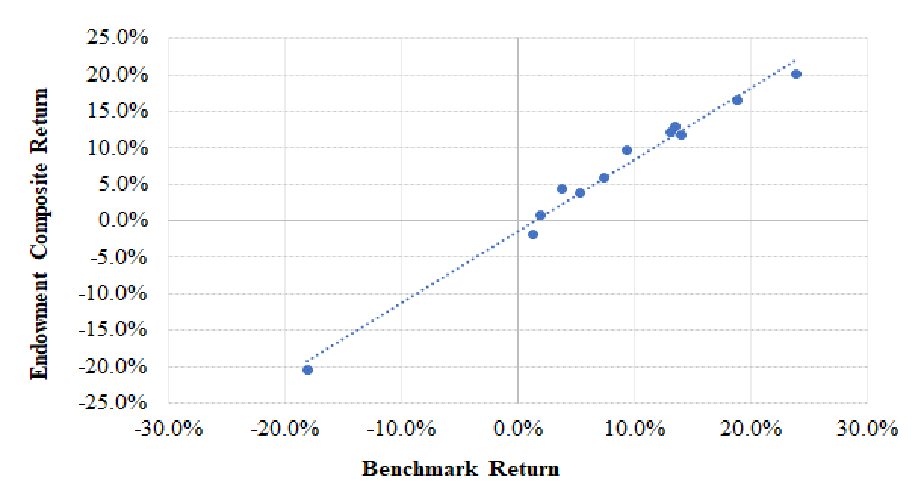
Advocates of including alternative investments in institutional portfolios claim that they provide a valuable source of diversification. Sometimes, this is described as they being “uncorrelated” (meaning imperfectly correlated) with stocks and bonds and thus acting as diversifiers. We find no evidence to support this proposition. Exhibit 12 illustrates the regression of the returns of the large endowment composite on those of the Post-GFC benchmark as described in Exhibit 4 (72% stocks and 28% bonds). The slope (beta) is 0.99; the R2 is .98, and the standard error of the regression is a minimal 1.4%. The intercept, or alpha, is -1.47% (t-statistic of -2.9). We note in passing that the annual standard deviation of return for composite and benchmark are nearly identical, at 10.62% and 10.67%, which is to say there is no evidence of so-called volatility dampening in the return series of the alts-heavy composite. Moreover, in this analysis we make no attempt to adjust for the return-smoothing characteristics of alternative investments, which account for more than half the assets of the composite. Exhibit 12 shows that stock and bond indexes capture the return-variability characteristics of alternative investments in the endowment composite for all intents and purposes; alternative investments do not have a meaningful impact. The finding that the correlation between a composite of funds with an average alts exposure of 51% and a marketable securities benchmark is near-perfect runs counter to the popular notion that the return properties of alts differ materially from those of stocks and bonds. That, after all, is an oft-cited reason for incorporating alternative investments in institutional portfolios. But as we see here, alt returns simply blend in with broad market returns in the context of standard portfolio analysis.
Exhibit 12
Regression of Large Endowment Fund Composite on Benchmark Returns
Twelve Years Ended June 30, 2020
Performance Impact of Alternative Investments
Exhibit 13 shows total fund alpha versus alts allocation for the six endowment fund size-cohorts (described in Exhibits 6 and 7) through June 30, 2019. The regression line pertains only to Cohorts 1-5. The R2 is .89. The slope coefficient is statistically significant (t-stat of -4.9), and the standard error of regression is a mere 0.10%. A very strong relationship exists, in other words.[21] For funds with alternative investment allocations of up to about 40% of total assets, alternatives detract from performance and the more you have, the worse you do. For Cohorts 1-5, a reduction in total fund alpha of approximately 20 bps is associated with every 10% of assets allocated to alts. A 40% alts allocation results in a penalty of 79 bps.
Exhibit 13
Relationship of Total Fund Alpha to Alts Allocation Percentage
For NACUBO Endowment Fund Cohorts
(Eleven Years Ended June 30, 2019)
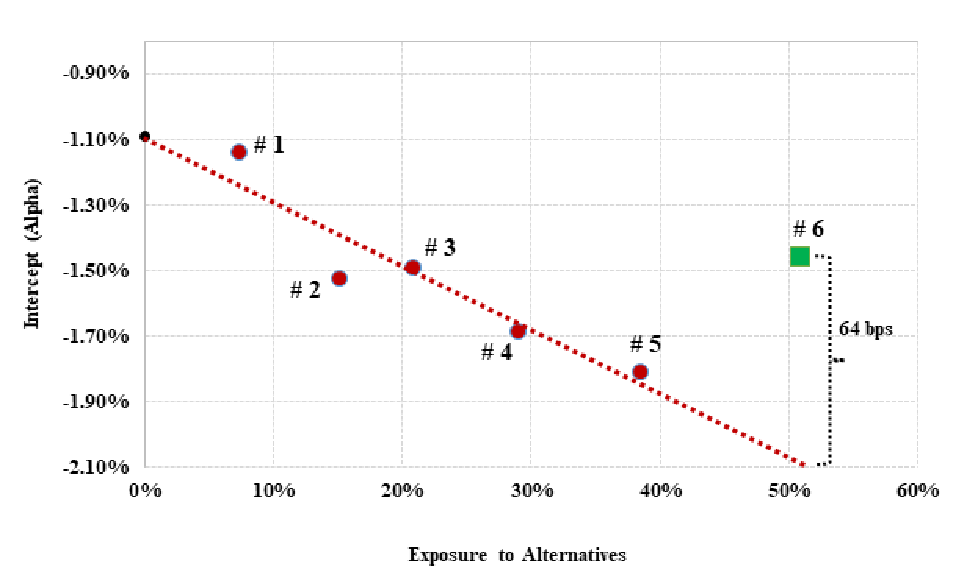
Cohort 6 (funds with assets greater than $1 billion) stands apart from Cohorts 1-5 in Exhibit 14, statistically as well visually. Total fund alpha of Cohort 6, although still negative by nearly 1.5%, is 64 bps better than the regression equation would indicate for endowments with an average allocation to alternatives of 51% (a 6.5-sigma outlier relative to the regression line). It is reasonable to conjecture that the more skilled practitioners of alternative investing are to be found among those with the heaviest allocations there. Which is to say, there is arguably an indication of skill among at least some of the practitioners of alternative investing. Anecdotally, three (and only three) stand out with positive total fund alphas of greater than a percentage point. They are MIT, Bowdoin College and Michigan State University. All maintain alternative allocations of 55% or more and, yet, achieved alphas at the total fund level of +2.07%, +2.03% and +1.39%%, respectively. Alas, even these fetching figures do not rise to the level of statistical significance.[22]
COST AND DIVERSIFICATION
We posit that marketable securities portfolios cost the investor 0.5% to 0.9% of asset value, depending on the size of the portfolio, the mix of stocks and bonds, the use of passive versus active management and turnover rates. The cost of alternative investments begins at about 1% of asset value for open-end diversified (core) equity real estate funds. Estimates of the cost of private equity investing approximate 6.0% of invested capital.[23] The cost of hedge funds, non-core real estate and private debt fall between those extremes. We estimate the cost of a typical portfolio of diverse alternative investments to be in the range of 2 to 4% of value annually. We further estimate that across the spectrum of endowment funds, the cost of investing ranges from 1 to 2% of assets annually.[24] More specifically, assuming a cost of 0.6% for marketable securities and 2.5% for a diverse portfolio of alternative investments, a portfolio with an allocation of 50% to alternatives would incur an annual cost of 1.55% of asset value. The median R2 of the individual funds reported on in Exhibit 9 is approximately 96% with an associated standard error of return relative to benchmark of 2.7%. If an endowment with that degree of diversification incurs costs of 1.5% annually, the likelihood of it underperforming a passive benchmark over a decade is 96%.[25] Here lies the crux of the problem of running high-cost diversified portfolios: The math simply doesn’t work.
CONCLUSION
All eyes remain on the large endowment funds. They appear to be at a crossroads. For the past 12 years, their heavy reliance on alternative investments has been a drag on performance. If they stand pat, they risk suffering continuing underperformance of 1-2% per year. Is there reason to believe that alternative assets will spring back to life as generators of alpha? What might bring this about? Alternatively, are endowment managers capable of a different kind of bold action going forward? If so, what might that be?
APPENDIX: LONG-TERM PERFORMANCE OF SMALL ENDOWMENTS
Exhibit A.1 shows the fiscal-year annual excess returns of NACUBO’s small endowment cohort over the 46 years of study. The simple average is -1.2% per year. Small endowments outperformed by a percentage point or more in just 3 of the 46 years. They underperformed passive investment even during the Golden Age, albeit by a smaller margin than in the other two eras. Even today, NACUBO’s small endowment cohort has an average of less than 10% in alternative investments, about half of which is hedge funds; consequently, the results are principally those of stock and bond managers’ performance. The small funds are disadvantaged by having to pay the highest rate of charge for asset management given typical graduated fee schedules. They also tend to be heavier users of expensive fund of funds in an effort to extend their reach. For nearly half a century, institutions with small endowments have been contributing more than 1% of their assets annually to the investment management and brokerage industries without benefit. Lacking significant resources for astute endowment management, the smallest institutions should drop active management altogether and avail themselves of passive alternatives.
Exhibit A.1
46 Years of Excess Return for Small NACUBO Endowments
REFERENCES
Asness, Clifford. 2018. “The Hedgie in Winter.” https://images.aqr.com/-/media/AQR/Documents/Insights/Perspectives/Cliffs-Perspective-05302018.pdf
Ennis, Richard M. 2020. “Institutional Investment Strategy and Manager Choice: A Critique.” Journal of Portfolio Management (Fund Manager Selection Issue): 104-117.
Fragkiskos, A., Sean Ryan and Michael Markov. 2018. “Alpha and Performance Efficiency of Ivy League Endowments: Evidence from Dynamic Exposures.” Alternative Investment Analyst Review, Vol 7, Issue 2.
Hammond, Dennis. 2020. “A Better Approach to Systematic Outperformance? 58 Years of Endowment Performance.” The Journal of Investing August 2020.
Ilmanen, Antti, Swati Chandra, and Nicholas McQuinn. 2020. “Demystifying Illiquid Assets: Expected Returns for Private Equity.” Journal of Alternative Investments, Volume 22 Issue 3.
Harris, R., T. Jenkinson, and S. Kaplan. 2014. “Private Equity Performance: What Do We Know?” The Journal of Finance 69 (5): 1851–1882.
L’Her, Jean-Francois, Rossita Stoyanova, Kathryn Shaw, William Scott and Charissa Lai. 2016. “A Bottom-Up Approach to the Risk-Adjusted Performance of the Buyout Fund Market.” Financial Analysts Journal, Volume 72, Issue 4 (July/August), pp. 36-48.
McKinsey & Co. “Equity Investments in Unlisted Companies: Report for the Norwegian Ministry of Finance.” November 2017.
Nelson, Thomas R., Thomas Porter, Harold H. Wilde. 1999. “Real Estate Assets on Corporate Balance Sheets.” Journal of Corporate Real Estate, December 31.
Pagliari, Joseph L., Kevin A Scherer and. Richard T. Monopolies. 2003. “Public versus Private Real Estate Equities.” The Journal of Portfolio Management: Special Real Estate Issue, 29 (5) 101-111.
Phalippou, L., and O. Gottschalg. 2009. “The Performance of Private Equity Funds.” The Review of Financial Studies 22 (4): 1747-1776.
Phalippou, Ludovic. 2014. “Performance of Buyout Funds Revisited.” Review of Finance, Review of Finance, Volume 18, Issue 1, January, Pages 189–218.
Rabener, Nicolas. 2018. “Private Equity: The Emperor Has No Clothes.” Enterprising Investor (CFA Institute blog) December 3.
Sharpe, W. F. 1988. “Determining a Fund’s Effective Asset Mix.” Investment Management Review (September/October): 16–29.
Sharpe ______. 1992. “Asset Allocation: Management Style and Performance Measurement.” Journal of Portfolio Management Winter: 7-19.
Sullivan, Rodney N. 2020. “Hedge Fund Alpha: Cycle or Sunset?” Forthcoming, Journal of Alternative Investing.
[1] Return series are through June 30, 2020, where available. Otherwise, there is a June 30, 2019, end date.
[2] The 60/40 benchmark in the Hammond study comprised the S&P 500 and an investment-grade bond index (Bloomberg Barclays Aggregate Bond Index). Prior to the inception of the Bloomberg Barclays Aggregate Bond Index, bonds were proxied variously, beginning with simple proxies to U.S. Treasuries.
[3] We require fiscal year annual return data to employ returns-based benchmarking, and FY 1974 is the first year for which such data are available.
[4] A brief discussion of the long-term performance of small endowments appears in the appendix.
[5] “Excess return” refers to the difference between actual and benchmark return.
[6] In analysis not presented, we determined that allocations to alternative investments were absorbed near-exclusively by U.S. market indexes, and predominantly by the Russell 3000 Stock Index.
[7] See Ennis (2020) for a detailed discussion of the cost-estimation procedure.
[8] NACUBO 2019 annual report, p. 55. This is the number of manager organizations. The number of individually managed portfolios, funds, partnerships, etc., is unknown but exceeds this number.
[9] Source: NACUBO Endowment Study 2019. While the 2019 Nacubo study reports on seven cohorts, we combined the Over $100 million - $250 million and Over $250 million - $500 million cohorts into one (as shown in # 4 in Exhibit 6) for consistency with past Nacubo studies where only six cohorts are reported. All Nacubo returns are represented as net of fees.
[10] The indexes used are Russell 3000, MSCI ACWI ex-U.S. and Bloomberg Barclays U.S. Aggregate.
[11] We use the term “risk-adjusted return” to describe value added as the intercept resulting from regression of a composite’s or fund’s return on a benchmark index. The terms “risk-adjusted return,” “intercept” and “alpha” are used interchangeably throughout the paper. We use “excess return” to describe the simple difference between the returns of a composite and its benchmark.
[12] Equal-weighted average of underlying institutions’ allocations to alt assets within the cohort.
[13] Ending June 30, 2019.
[14] The value factor is defined as the difference between the returns of Russell 3000 Value and Russell 3000 Growth indexes.
[15] The NACUBO Study reports on seven size cohorts, one of which comprises 107 institutions with endowments greater than $1 billion in value. However, NACUBO does not identify individual schools. To create the individual school dataset, we began reviewing the annual reports of schools with the largest endowments, starting with Harvard University. We soon discovered that many either do not report endowment fund returns, do not report the 11 consecutive returns required for the present study or have fiscal-year-ends other than June 30. We wound up acquiring complete return series for 35 of the 50 largest endowments. From there, we added data for other schools with assets greater than $1 billion, as best as we could locate them. An indication that the final sample of 43 funds may not be representative of all 107 funds (with assets greater than $1 billion) is that the average 11-year annual return of the sample exceeds that of NACUBO’s $1-billion-plus fund cohort by approximately 40 bps. While the 43 individual fund returns we obtained are not suspect in our minds, they may not be fully representative of the large fund cohort. Accordingly, we use the individual fund returns only in cross-sectional analysis and not as indicative of the large fund cohort itself. We assume, without confirmation, that returns are net of fees.
[16] For real estate, we subtract the returns of the FTSE NAREIT All-Equity REIT Index from those of the Cambridge Associates Real Estate Index, using quarterly IRRs to estimate TWRs for the Cambridge series. For buyout funds these are the average excess returns reported by L’Her et al. (2016) in Tables 3 and 4 for size-, leverage- and sector-adjusted returns. The hedge fund excess returns are as reported by Sullivan (2020).
[17] See FTSE NAREIT Real Estate Index Historical Market Capitalization, 1972 - 2018 (NAREIT) and REIT Industry Monthly Data for December 2019 (NAREIT 2019).
[18] Hedge fund assets under management in 1997 totaled approximately $118 billion. The figure grew twenty-seven-fold to $3.2 trillion in 2018 with much of the influx occurring in a handful of years leading up to the Great Financial Crisis. Source: HFR (2019).
[19] Private equity assets under management of $100 billion in 1994 grew thirty-seven-fold to $3.7 trillion in 2019. Sources: HFR (2019);; Federal Reserve Bank of Dallas, December 1995.
[20] See Ennis (2020) for a fuller discussion of the evolution of alternative investment markets over two decades.
[21] Cohorts 1-5 contain 60 to 280 endowments each, for a total of 567 endowments with less than $1 billion. In other words, the regression equation illustrated in Exhibit 14 is informed by a much larger sample than simply five data points.
[22] There is a parallel here with the experience of professional gamblers. We know that most amateurs that enter a casino will depart losers. Studies have shown that a tiny percentage (about 1%) of professional gamblers exit winners with some consistency. (These happen to be the whales.) Another group (about 5%) usually exit losers, albeit with smaller losses than the Average Joe. The three large endowments cited above are analogous to the group of about 1% of gamblers cited in a study of fantasy-sports betting by McKinsey & Co. In both cases, there are rare winners in a game marked by a preponderance of losers of varying degree.
[23] See McKinsey & Co. (2017) and Phalippou and Gottschalg (2009).
[24] See Ennis (2020) for a detailed discussion of the cost-estimation procedure.
[25] The probability reflects the area under a normal distribution curve with a tracking error of 2.7% and incorporating a cost of 1.5% per year.

