The Long-Run Performance of Public Pension Funds in the US
This paper examines the investment performance of public pension funds in the US between 2001 and 2021. We identify two distinct eras of public fund performance, separated by the Global Financial Crisis of 2008 (GFC). We examine the role alternative investments played in shaping the two eras. We offer conjecture as to what the future holds for public pension investing.
BACKGROUND
Two principal factors motivated managers of public pension funds to invest in alternative investments, or alts, as they are commonly known. One was the belief that private markets were less efficient than public ones and that fund managers would be able to exploit that inefficiency. A second was the belief that returns of alts were not highly correlated with those of stocks and bonds, providing a pick-up in expected risk-adjusted return, i.e., a profitable diversification opportunity. Exhibit 1 shows aggregate alternative investments as a percentage of asset value for US public pension funds between 2001 and 2021, increasing from 9% to 29% of the total. The principal categories of alternative investment used by the funds are private equity, private real estate and hedge funds.
Exhibit 1
Public Pensions’ Allocation to Alternative Investments (%)
|
Year |
Private Equity |
Private Real Estate |
Hedge Funds |
Com- modities |
Misc. Alts |
Total Alts |
|
2001 |
4 |
5 |
0 |
0 |
0 |
9 |
|
2002 |
4 |
5 |
0 |
0 |
0 |
9 |
|
2003 |
4 |
4 |
0 |
0 |
0 |
8 |
|
2004 |
4 |
4 |
0 |
0 |
0 |
8 |
|
2005 |
4 |
4 |
1 |
0 |
0 |
9 |
|
2006 |
4 |
5 |
1 |
0 |
1 |
10 |
|
2007 |
5 |
6 |
2 |
0 |
1 |
14 |
|
2008 |
7 |
7 |
2 |
1 |
1 |
18 |
|
2009 |
7 |
6 |
3 |
1 |
1 |
18 |
|
2010 |
8 |
6 |
3 |
1 |
1 |
19 |
|
2011 |
9 |
7 |
4 |
1 |
1 |
22 |
|
2012 |
9 |
8 |
5 |
1 |
1 |
24 |
|
2013 |
9 |
8 |
5 |
1 |
1 |
24 |
|
2014 |
8 |
8 |
6 |
1 |
1 |
24 |
|
2015 |
8 |
8 |
7 |
1 |
1 |
25 |
|
2016 |
8 |
9 |
7 |
2 |
1 |
27 |
|
2017 |
8 |
8 |
7 |
2 |
1 |
26 |
|
2018 |
9 |
8 |
7 |
2 |
1 |
27 |
|
2019 |
9 |
9 |
7 |
2 |
1 |
28 |
|
2020 |
9 |
9 |
6 |
2 |
1 |
27 |
|
2021 |
11 |
8 |
6 |
2 |
2 |
29 |
Source: Public Plans Data, Center for Retirement Research, Boston College
PERFORMANCE
Data and Methodology
We obtained fiscal year annual rates of return for individual pension plans from their annual reports and the Public Plans Data resource of the Center for Retirement Research (CRR) at Boston College. The earliest return data available from CRR is from 2001. We obtained the fiscal year annual returns of 54 funds that reported them net of investment expenses and for which allocation data regarding alternative investments were readily available. We created a composite return series by equal-weighting individual fund returns.
We used returns-based style analysis to establish benchmarks.[1] The market return series serving as independent variables are Russell 3000 stocks, MSCI ACWI ex-U.S. stocks (i.e., non-US stocks; both unhedged and hedged versions), and Bloomberg Aggregate US bonds.
In examining the data, we observed an increase in aggregate effective equity exposure over the course of the study period. In the early years (2001-2008), the average effective equity percentage was 66%. During the latter years (2009-2021), the figure was 71%.[2] In order to better calibrate performance benchmarks, we studied data for the two sub-periods separately and spliced the results together to get the long-term picture.[3]
The first sub-period concluded on the eve of the GFC. The second sub-period began with the GFC market crash and encompasses the years following. As the modern history of public pension investing unfolds, the GFC emerges as a watershed event.
Results
Exhibit 2 summarizes key statistics for the two sub-periods. First, it reports the effective asset allocation of the composite. These percentages define the performance benchmark. The performance statistics that follow are based on a simple linear regression of the composite returns on those of the benchmark. The power of the regressions is noteworthy, with extremely high R2s of 99.9% and 99.2% for the sub-periods. Also shown in the table are the regression intercepts (alphas), both of which are statistically significant. So, in the first era, the composite of public pension funds outperformed a benchmark with matching market exposures and risk by 1.2 percentage points per year. The sign of the alpha flipped in the second era, with the composite underperforming by 1.2 percentage points annually.
Exhibit 2
Simple Regression of Composite on Benchmark
|
|
Fiscal Years 2001-2008 |
Fiscal Years 2009-2021 |
|
US Stocks |
45% |
52% |
|
Non-US Stocks, Unhedged |
13 |
13 |
|
Non-US Stocks, Hedged |
8 |
6 |
|
US Bonds |
34 |
29 |
|
Total |
100% |
100% |
|
Beta Relative to Benchmark |
1.0 |
1.0 |
|
R2 of Composite on Benchmark |
99.9% |
99.2% |
|
Tracking Error |
0.3% |
1.1% |
|
Alpha (annualized) |
1.2% |
-1.2% |
|
Alpha t-Statistic |
9.0 |
-3.2 |
|
Average Allocation to Alts During Period |
9%[4] |
26% |
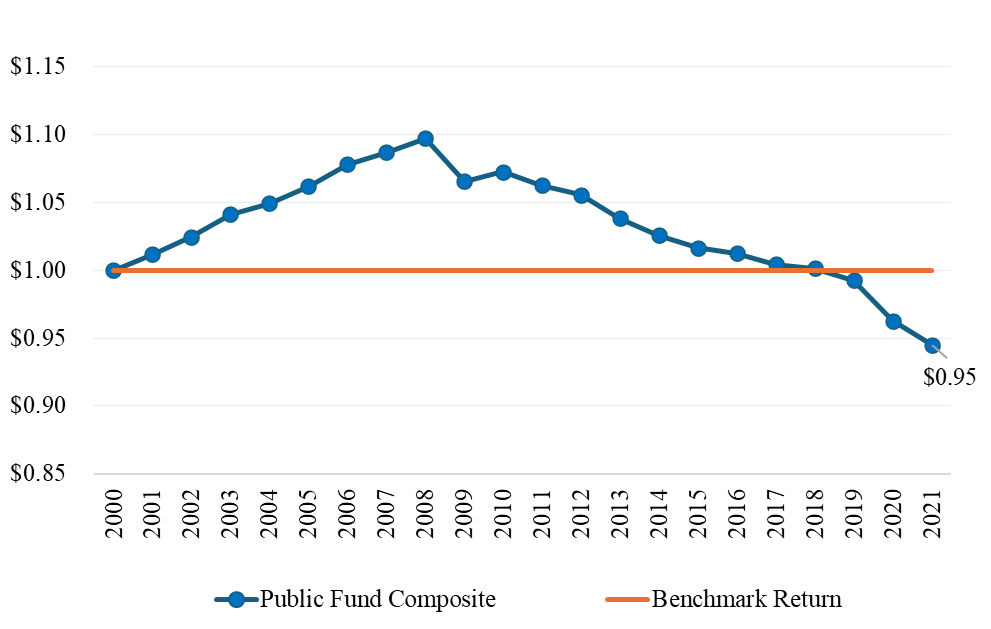
Exhibit 3 shows cumulative (unannualized) alpha over the full study period. (The horizontal line represents the benchmark.) The net cumulative alpha for the 21 years is -5%, as indicated by the ending relative wealth value of 0.95. Noteworthy is the year-to-year consistency of the results on either side of the peak, especially pre-GFC.[5] Also noteworthy is the abruptness of the reversal of fortune, with alpha going sharply negative in 2009. It has been a long, steady downward slide for public fund performance since the GFC.
Exhibit 3
Cumulative Alpha, 2001-2021
THE INFLUENCE OF ALTERNATIVE INVESTMENTS
Alts’ Performance Before and After the GFC
Alternative investments had a noteworthy influence on institutional investment returns throughout the 21 years studied here. Prior to the GFC, they were a source of value added. But post-GFC, they contributed to the underperformance of institutional funds. In Ennis (2021), we examined the performance of real estate, buyouts and hedge funds before and after the GFC. Exhibit 4 summarizes our assessment of value added for the three alts categories, pre- and post-GFC.[6]
Exhibit 4
Annualized Excess Return of Alternative Investments, Before and After GFC
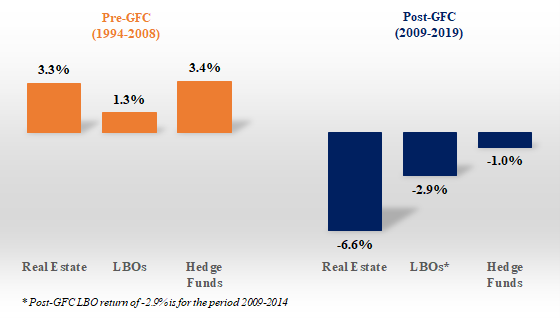
Source: Ennis (2021)
Alts’ Impact on Public Fund Performance
We find that public funds’ experience with alternative investments exhibits a pattern consistent with the one portrayed in Exhibit 4. That is, alts had a favorable impact on fund performance pre-GFC and an unfavorable impact post-GFC. For both eras, we calculated the alpha of each fund in the 54-fund dataset using the returns-based benchmarking methodology described above. We also calculated the average percentage allocation of each fund to alts for the two eras. Then we regressed fund alphas on the alts allocation percentages. This analysis tells us how increasing (decreasing) allocations to alts affected alpha.
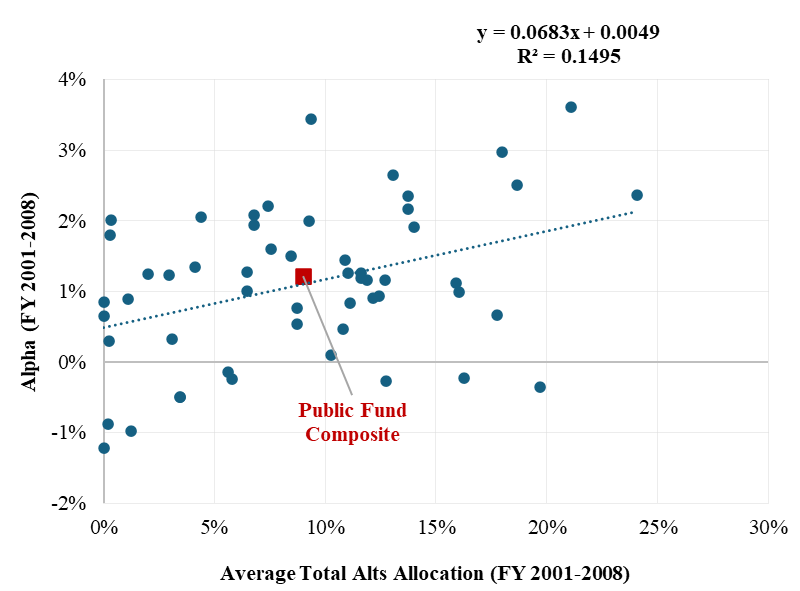
Exhibit 5 shows the relationship of alpha and alts allocation during the 2001-2008 period. An increase in annual alpha of approximately 7 bps is associated with each percentage point increase in the allocation to alts. Which is to say, substituting aggregate alts for stocks and bonds had the effect of increasing alpha. The 7-bps slope coefficient is statistically significant, with a t-statistic of 3.0. (The intercept is also statistically significant, with a t-statistic of 2.0.) Fifteen percent of the variation in alpha (R2) is explained by variation in the aggregate allocation to alts. Accordingly, public funds’ relatively modest alts exposure in the early years of the study contributed to the funds earning a positive alpha.
Exhibit 5
Relationship of Pension Fund Alpha and Alts Allocation Percentage, Pre-GFC
(2001–2008)

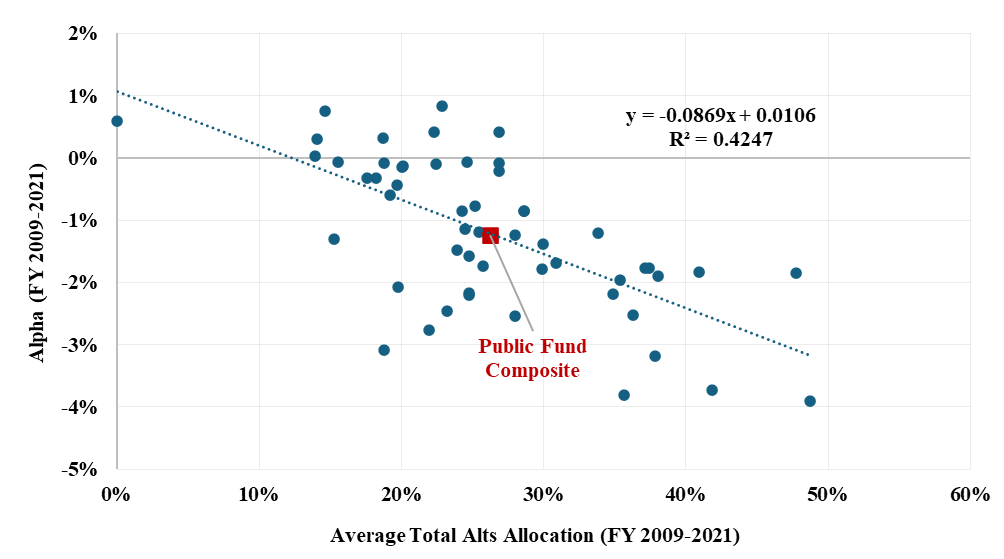
Tables were turned during the 2009–2021 sub-period. Exhibit 6 shows that a decrease of approximately 9 bps was associated with each percentage point increase in the alts allocation percentage. (The t-statistic is -6.2). The R2 of the regression is 42%. Alts influence after the GFC was more pronounced than in the earlier period and was sustained longer (13 years vs. 8 years).
Exhibit 6
Relationship of Pension Fund Alpha and Alts Allocation Percentage, Post-GFC
(2009–2021)
Alternative investments were not the whole story behind public fund performance in the 21-year period under study. The results presented in Exhibits 5 and 6, do, however, indicate that alts played an economically and statistically significant role in the performance of these funds. And for the most recent sub-period, and the longer of the two, alts had a decidedly adverse effect.
DISCUSSION
Much has been written about the starring role of alternative investing since the exceptional David Swensen of Yale University came up with the concept in the latter part of the 1980s. We have nothing to add to the narrative of alts rising. We do attempt to shed light on the more recent experience of institutional investors with alts.
The GFC was a wake-up call for owners of highly leveraged, illiquid assets. Big private asset investors, such as the major university endowment funds, took a real hit. The average return of Harvard, Yale and Princeton for fiscal year 2009 was -25.1%. This compares to just -13.3% for a 60-40 allocation to S&P 500 stocks and investment-grade bonds. Things have been downhill for alts since then, although this fact has been little acknowledged by ardent enthusiasts of alternative investing.
Over the course of the two decades studied here, trillions of dollars poured into what had been small markets for alternative investments. Public funds alone increased their alts from $190 billion to $2.3 trillion.[7] Countless private investment funds are in the market today. Private asset markets are much deeper and more competitive than they were in 2000, and they are better integrated with public markets. Hedge fund assets increased tenfold between 2000 and 2007.[8] It would be a mistake to assume that alternative investing today is characterized by market inefficiency, which has long been the centerpiece of the argument favoring private assets. Joining heightened market competitiveness in explaining the lackluster performance of alts is their high cost. We estimate the cost of managing the typical public pension fund, with 34% of assets currently allocated to alts, is 1.3% of asset value annually.[9] All considered, this is an insurmountable hurdle.
Given the twin challenges of market competitiveness and high cost, it is difficult to envision pension funds, laden with alternative investments, once again churning out sustained, attractive, risk-adjusted returns.
REFERENCES
Center for Retirement Research, Boston College: Public Plans Data (https://publicplansdata.org)
Crain, N. and K. Law. 2018. “The Bright Side of Fair Value Accounting: Evidence from Private Company Valuation. Available SSRN:
https://ssrn.com/abstract=3040396 or http://dx.doi.org/10.2139/ssrn.3040396
Ennis, R.M. 2021. “Failure of the Endowment Model.” Journal of Portfolio Management (Investment Models Issue): 47 (5): 128-143.
———. 2022. “A Universal Investment Portfolio for Public Pension Funds: Making the Most of Our Herding Ways.” The Journal of Investing 32: (1) 7-20.
———. 2024. “How Hidden Costs Undermine Public Pensions in the US.” Forthcoming in The Journal of Investing. Available at SSRN: https://papers.ssrn.com/sol3/papers.cfm?abstract_id=4815227.
Sharpe, W. F. 1988. “Determining a Fund’s Effective Asset Mix.” Investment Management Review (September/October): 16–29.
——— . 1992. “Asset Allocation: Management Style and Performance Measurement.” Journal of Portfolio Management Winter: 7-19.
Sullivan, R.N. 2021. “Hedge Fund Alpha: Cycle or Sunset?” The Journal of Alternative Investments, Winter 23(3): 55-79.
[1] See Sharpe (1988, 1992).
[2] We describe this development more fully in Ennis (2022).
[3] We omitted returns for 2022 and 2023, which reflect significant return smoothing. The US stock market declined sharply in the fourth quarter of fiscal year 2022. The net asset values (NAVs) used in valuing institutional fund returns at year-end 2022 did not reflect the decline in equity values owing to the practice of using NAVs lagged by one or more quarters in portfolio valuations. The equity market rose sharply the following year, and once again marks for private assets lagged as NAVs began to reflect the prior downturn. The overall effect was to sharply attenuate losses in reporting for 2022 and tamp down gains in 2023. It will take at least through 2024, and possibly 2025, before these effects wash through the valuation process.
[4] This figure differs slightly from the 10.6% average for the first eight years in Exhibit 1. The 9% figure pertains to the 54 funds in the sample, whereas Exhibit 1 is based on the full population of public funds in the PPD database.
[5] All eight of the return residuals that went into making up the pre-GFC experience in Exhibit 3 are positive within a narrow range, which is a bit of a statistical oddity for residuals. The total returns, from which the residuals derive, exhibit positive autocorrelation during that period, hinting at the presence of valuation momentum. (The positive autocorrelation disappears beginning in 2009.) The prevailing accounting treatment of private assets may have had a bearing on these findings. Prior to 2009, there was no requirement to incorporate principles of market pricing in the valuation of private assets. Accordingly, cost, or another form of book value, prevailed in valuing private assets. That changed with the advent of Accounting Standards Codification (ASC) 820 in 2008, which required use of a market basis in valuing private assets. Crain and Law (2018) find that “…after the use of fair value accounting, fund managers more frequently revise their valuations down and lower the magnitude of upward valuation across all quarters.” They find that “valuation bias” is greatly reduced subsequent to the advent of ASC 820.
[6] For real estate, we subtract the returns of the FTSE NAREIT All-Equity REIT Index from those of the Cambridge Associates Real Estate Index, using quarterly IRRs to estimate TWRs for the Cambridge series. For buyout funds these are the average excess returns reported by L’Her et al. (2016) in its Tables 3 and 4 for size-, leverage- and sector-adjusted returns. Hedge fund excess returns are those reported by Sullivan (2021).
[7] See Pension Plan Data: https://publicplansdata.org/quick-facts/national/.
[8] See Sullivan (2021).
[9] See Ennis (2024)

