Hedge Funds: A Poor Choice for Most Long-Term Investors
Hedge funds have become an integral part of institutional portfolio management. They constitute about 7% of public pension assets and 18% of large endowments. How to judge whether they are good for institutional investors? We apply two criteria: (1) One combines consideration of cost and past performance; (2) the other assesses whether or not hedge funds mesh with long-term investment strategy. We also identify the case in which hedge funds can be used with the greatest effect.
COST AND PERFORMANCE
Cost
The typical compensation of hedge fund managers is a management fee of 2% of assets plus 20% of profits. According to Ben-David et al. (2023), hedge funds’ “2-and-20” adds up to more than 2 and 20. They estimate the effective incentive rate is 50%, which is 2.5 times as great as the nominal 20% figure. The authors say, “This happens because about sixty percent of the gains on which incentive fees are earned are eventually offset by losses.”[1] They calculate an average annual total cost of 3.44% of assets under management for the hedge fund industry between 1995 and 2016. This is a heavy burden for what are essentially portfolios of publicly traded securities. How have the funds fared?
Performance
Hedge funds were star performers prior to the Global Financial Crisis of 2008 (GFC). But then things changed. Hedge funds seem to run out of gas after the GFC.[2] Maybe it was because hedge fund assets increased tenfold between 2000 and 2007.[3] Maybe it was because of the accounting rule change regarding the valuation of partnership assets that took effect in 2008.[4] And, possibly, increased regulatory oversight from the 2010 Dodd–Frank reforms “…chilled some profitable hedge fund trading….”[5] In any event, diversified hedge fund investing appears to have underperformed in modern (post-GFC) times. For the 15 years ending June 30, 2023, the HFR Fund-Weighted Composite Index had an annualized return of 4.0%. This compares to a 4.5% return for a blend of public market indexes with matching market exposures and risk, namely, 52% stocks and 48% Treasury bills.[6] Accordingly, the hedge fund composite underperformed by 0.5% per year.[7]
Apart from this result, the recent scholarly literature on hedge fund performance is mixed. Sullivan (2021) reports that hedge fund alpha went into decline after the GFC. Bollen et al. (2021) reaches a similar conclusion. A more recent paper by Barth et al. (2023) indicates that a newly emergent subset of hedge funds—those not included in vendor databases—have produced returns superior to those that do participate in the databases. The reason for this is not entirely clear. Nevertheless, the revelation of the existence of these heretofore overlooked funds suggests that they warrant further study and leaves the merit of hedge fund investing open to debate among the scholars.
In our work, we like to focus on how an asset class, such as hedge funds, has affected the alpha garnered by the institutional investor portfolios we study. This approach is concrete and pragmatic. We calculate the alphas of a large sample of pension funds. Then we determine the sensitivity of alpha production among the funds to small changes in the percentage allocation to the asset class. Here, we are observing the return impact of each fund’s actual allocation to hedge funds and the performance impact of those hedge funds on the institutions’ bottom line. There is nothing nebulous or hypothetical about the procedure.
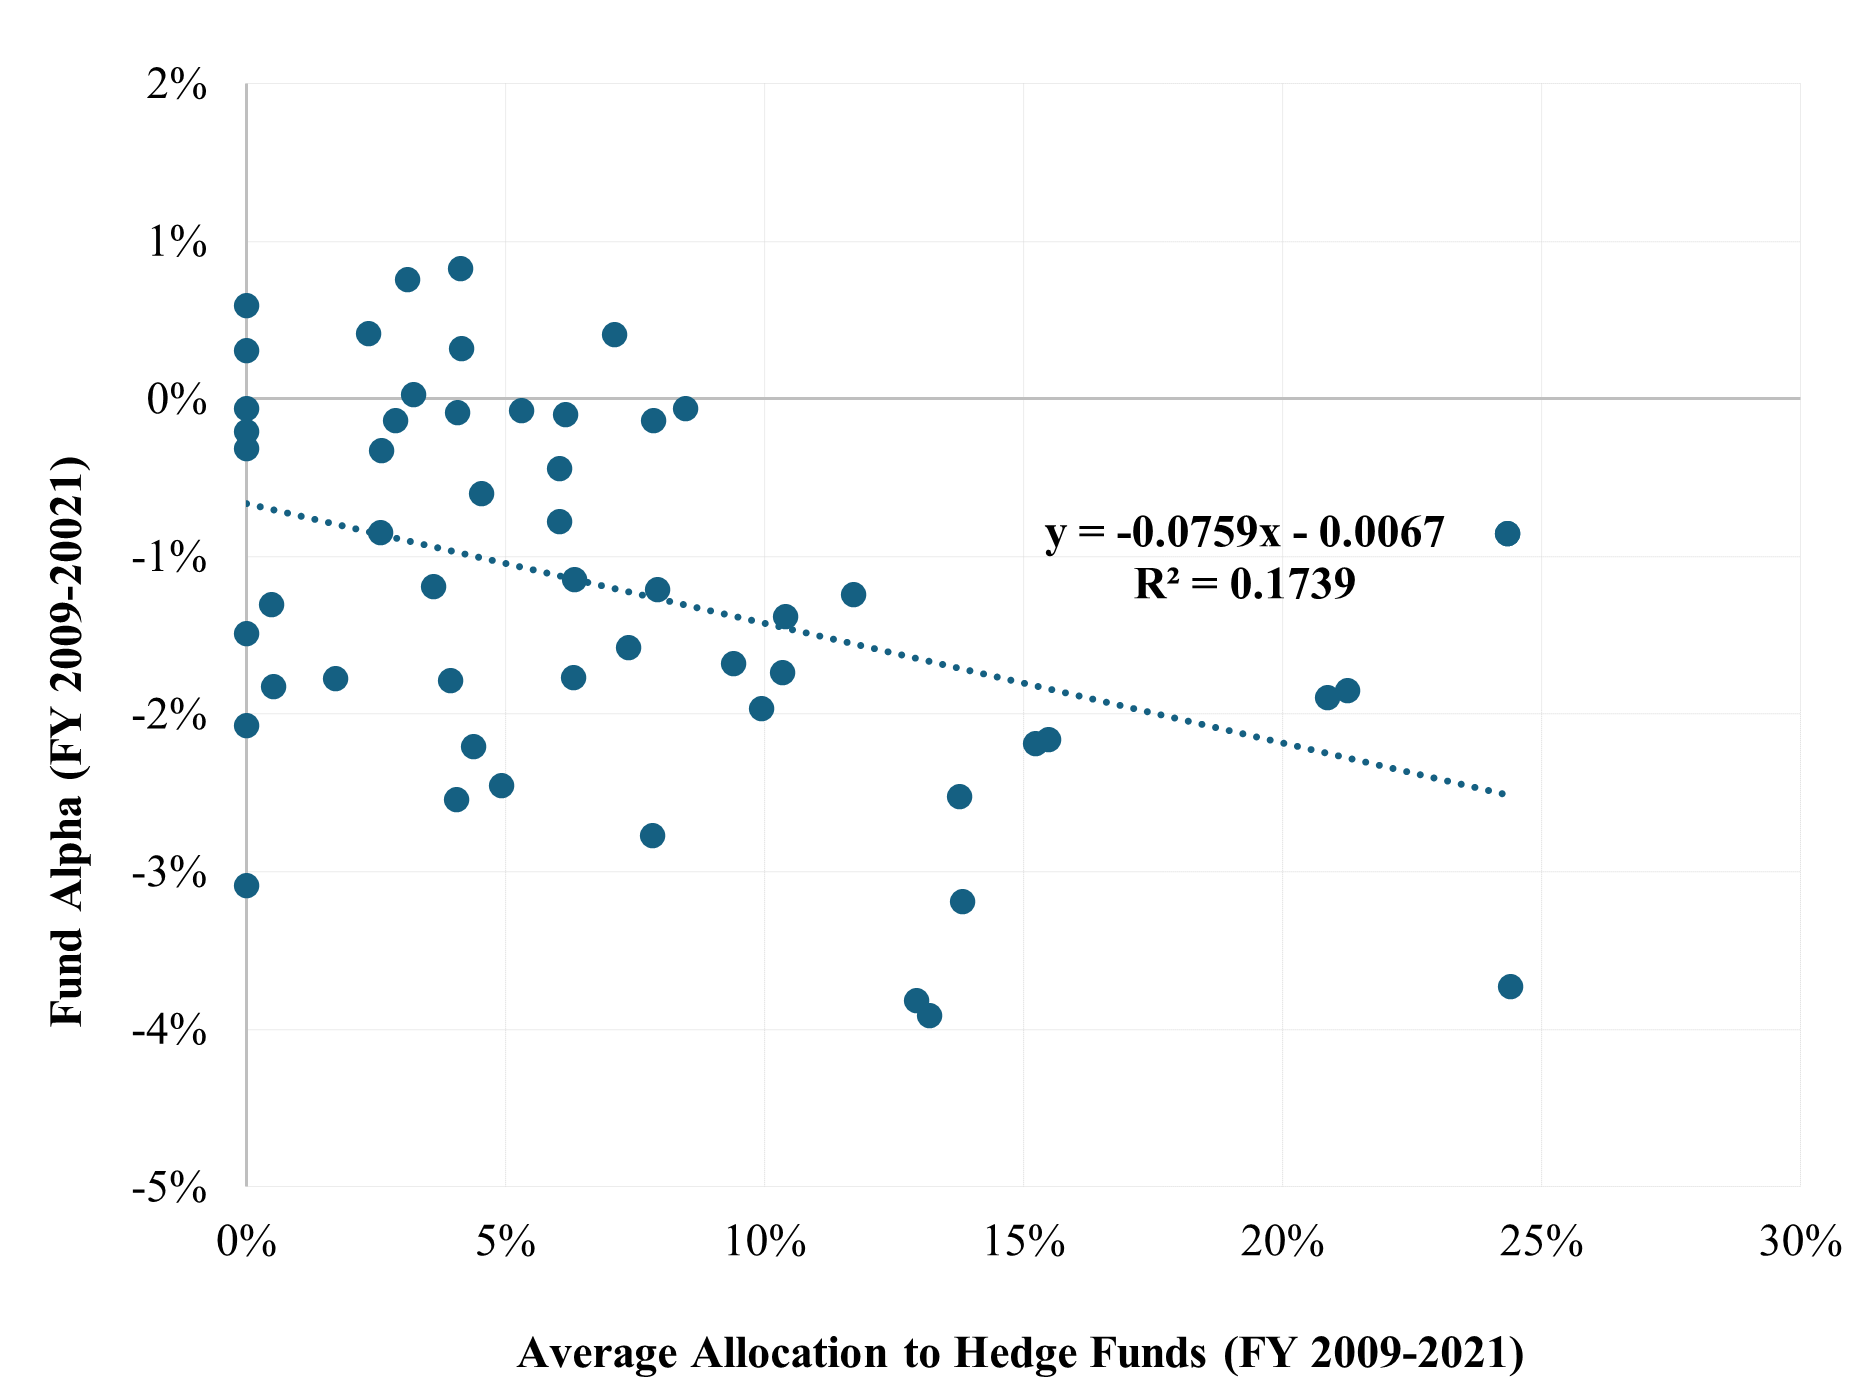
Our dataset of institutional funds consists of 54 US public pension funds. Using returns-based style analysis, we devised a benchmark for each of them and calculated their alpha over the 13 years ended June 30, 2021.[8] The range of alphas is -3.9% to +0.8 per year, or a little less than five percentage points. For each pension fund, we obtain the average allocation to hedge funds over the study period from the Public Plans Data resource of the Center for Retirement Research at Boston College. The minimum average allocation was 0%; the average average was 7.3%; and the maximum average allocation was 24.4%. Exhibit 1 illustrates the result of regressing the alphas on the respective hedge fund allocation percentages. The slope coefficient of -0.0759 has a t-statistic of -3.3, indicating a statistically significant relationship. We can interpret the slope coefficient as follows: A decrease of 7.6 bps in total pension fund alpha is associated with each percentage point increase in the hedge fund allocation percentage. The average allocation to hedge funds for the full 54-fund sample is 7.3% during the period under study. This translates to an alpha reduction of 0.55% per year at the total fund level for public funds in aggregate (.073 x -7.6). That is a big hit for an asset class the constitutes less than 10% of assets under management.
Exhibit 1
Relationship Between Pension Fund Alpha and Allocation to Hedge Funds (2009-2021)
Summing up so far: Hedge funds are diversified portfolios of publicly traded securities. A recent estimate of their cost to investors is 3.4% of asset value annually, which is a very heavy burden. Using HFR data, we estimate that hedge funds underperformed a benchmark with matching market exposures and risk by 0.5% per year since the GFC. The scholarly literature on hedge fund performance is mixed. Our evaluation of the impact of hedge fund investing on the performance of public pension funds since the GFC indicates that an average allocation of about 7% of assets has cost the funds, in aggregate, roughly 50 bps of alpha a year. Taken as a whole, these results challenge the wisdom of investing in hedge funds—at least in diversified fashion—as a source of value added.
A QUESTION OF FIT
Institutional investors have steadily increased their equity exposure over time. Public pension funds’ equity exposures, which were 40% to 50% in 1980, rose steadily to more than 70% of late. Large endowments’ effective equity exposures have edged up to between 80 and 85% in recent years. Institutional investors demonstrate sustained confidence that equities are the key to growth over the long run. More recently, these investors have been attracted to hedge funds for their added-value potential. But are hedge funds really a good fit for them, regardless of their potential as active investments?
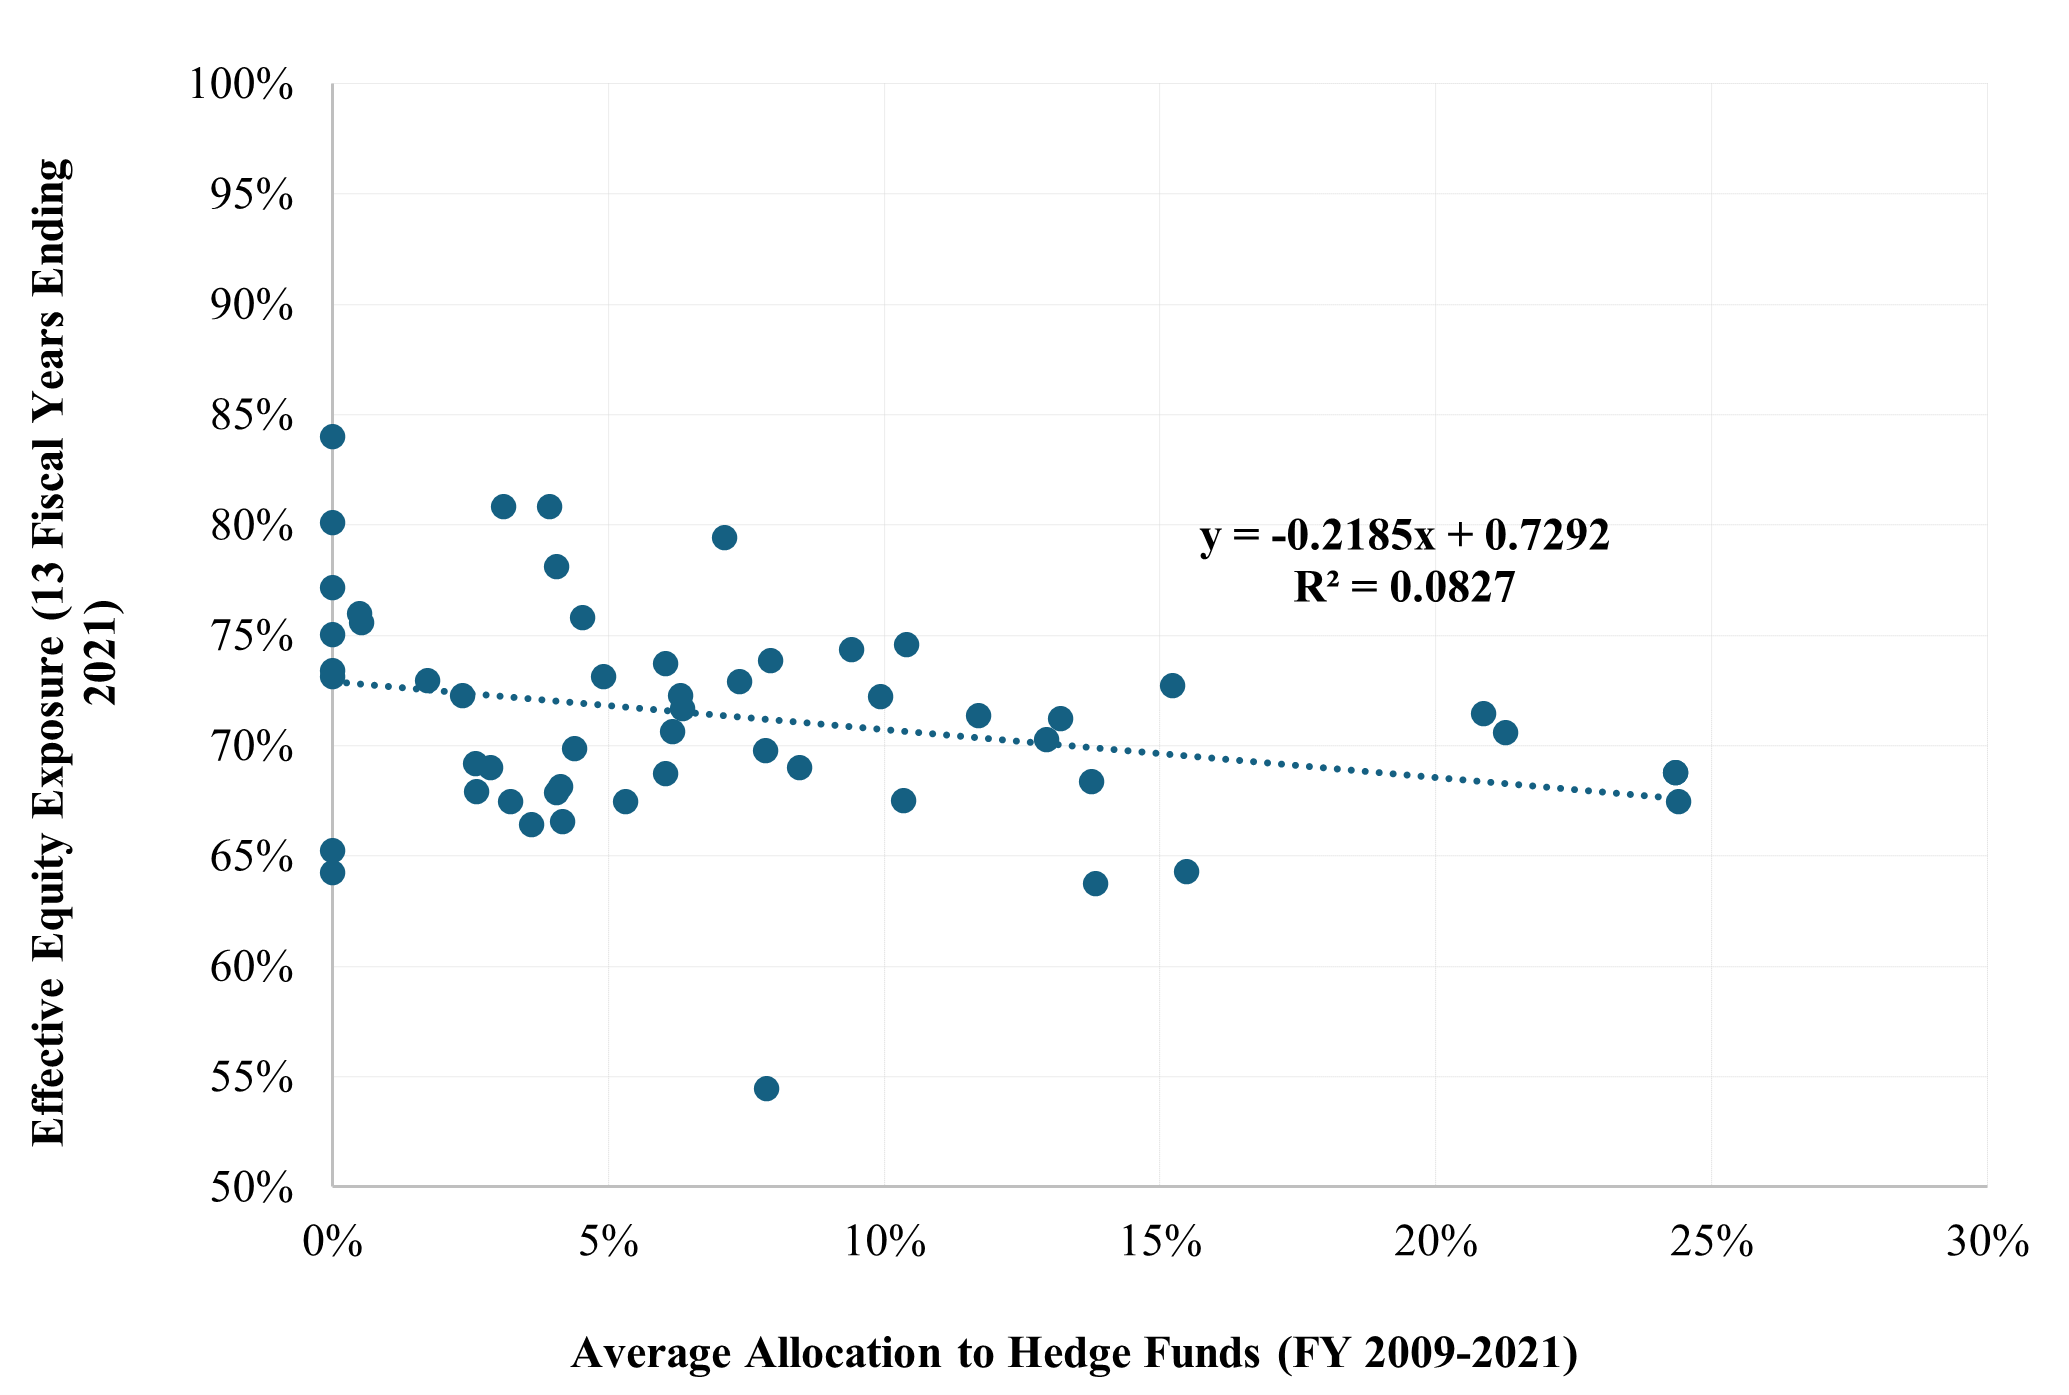
Asness (2018) offers anecdotal evidence of a common misperception about hedge funds. He argues that, by comparing their performance to stock indexes such as the S&P 500, people tend to think of hedge funds as common stock surrogates. He reports, however, that hedge funds generally hedge their equities and have an equity exposure of “…just under 50%.” So, hedge funds, in general, have a beta much lower than 1.0. (Some hedge funds aim to maintain a beta as close to zero as possible.) Thus, in substituting hedge funds for stocks, investors may be unwittingly reducing their equity exposure. Exhibit 2 shows the relationship of effective equity exposure and the percentage allocated to hedge funds for our sample of 54 public funds. The intercept is a highly statistically significant 72.9% equities. A 1.6-percentage point lesser equity allocation is associated with a 7.3-percentage point hedge fund allocation, which is the average among the pension funds. (The t-statistic of the slope coefficient is -2.2, indicating statistical significance.) This relationship is consistent with the notion of there being a perception that hedge funds bring greater equity exposure than is actually the case: Public pension funds with large hedge fund allocations tend to have lower de facto equity allocations; they may be unwittingly tamping down their equity market exposure with their hedge fund allocations.
Exhibit 2
Relationship between Equity Exposure and Hedge Fund Allocation
Now, if hedge funds represented exceptional potential to add active return, allocating to them could be made tolerable by picking up additional equity exposure elsewhere.[9] But we find no evidence of an alpha contribution. Consequently, it seems to us that equity-beta-light hedge funds are not a particularly good fit for most long-term investors.
AVOIDING THE ASSET CLASS FALLACY
We believe exceptional talent, rare as it might be, exists in the ranks of hedge fund managers. Identifying exceptional managers and profiting from their skill is another matter. But we do not deny the existence of unusually skillful managers. A big problem for institutional investors is their penchant for over-diversifying active investments of all types, with hedge funds being no exception. Let us assume an institutional investor believes they can identify at least a few superior managers. How best to proceed?
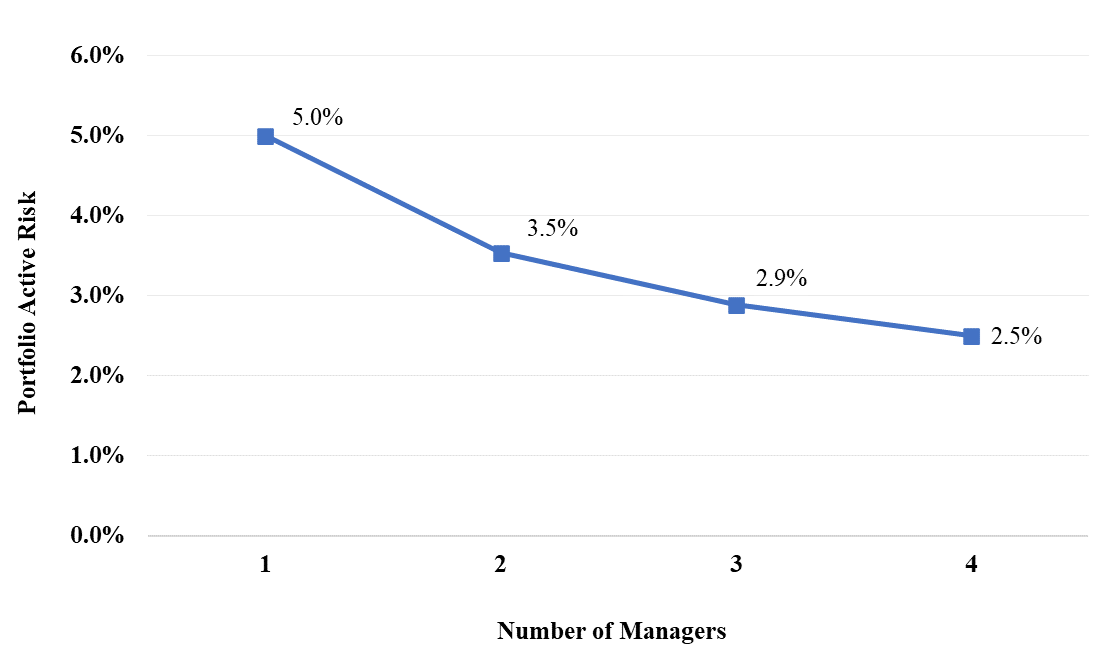
First, in structuring the effort, the investor should focus on managers, not the asset class. Nothing is to be gained from declaring to the world, “We will place X% of our assets in hedge funds.” This is the asset class fallacy of hedge fund investing. It makes picking a passel of winning hedge funds sound routine, which it definitely is not. In our judgment, the class of assets has little or nothing to offer. The allocation to hedge funds should ebb and flow with perceived opportunity in specific funds. Second, we recommend restricting the total number of hedge funds to not more than about three or four to avoid smothering the exceptional talent of the best managers. Exhibit 3 illustrates the diversification of active risk resulting from using multiple managers.[10] Using four managers rather than one cuts active risk in half. Further manager diversification produces only incremental risk reduction. But it quickly runs the risk of diluting the impact of the top selections.
Exhibit 3
The Diversification of Active Risk
Institutional investors interested in hedge funds face a conundrum: Yield to the diversification instinct typically exhibited by institutional fiduciaries and trivialize the selection challenge? Put it on the line via large enough placements with a few managers that might make a difference? Simply avoid the area altogether? As the proverb goes, you can’t have your cake and eat it too.
SUMMARY
For years, hedge fund investments have reduced the alpha of most institutional investors (helped drive it negative, actually). At the same time, they deprive long-term investors of desired equity exposure. In other words, hedge funds have been alpha-negative and beta-light. For these reasons, it is difficult to see a strategic benefit to having a diversified hedge fund allocation in the mix for most endowment and pension funds. If, however, an institution has access to a few truly exceptional hedge funds and can resist the temptation to diversify hedge fund exposure excessively, a small allocation may be warranted.
ACKNOWLEDGEMENT
I thank Antti Ilmanen for his helpful comments.
REFERENCES
Asness, C. 2018. “The Hedgie in Winter.” AQR Insights. https://www.aqr.com/Insights/Perspectives/The-Hedgie-in-Winter.
Barth, D., J. Joenvaara, M. Kauppila and R.R. Wermers. (2023). “A Bias-Free Assessment of the Hedge Fund Industry: A New Evaluation of Total Assets, Alphas, and the Flow-Performance Relation.” OFR WP 20-01. Available at SSRN: https://ssrn.com/abstract=3544181 or http://dx.doi.org/10.2139/ssrn.3544181
Ben-David, I., J. Birru, and A. Rossi. 2023. “The Performance of Hedge Fund Performance Fee.” Fisher College of Business Working Paper No. 2020-03-014. Available at SSRN: https://ssrn.com/abstract=3630723 or http://dx.doi.org/10.2139/ssrn.3630723
Bollen, N.P.B., J. Joenvaara and M. Kauppila. 2021. “Hedge Fund Performance: End of an Era?” Financial Analysts Journal, 77:3, 109-132.
Center for Retirement Research, Boston College: Public Plans Data (https://publicplansdata.org)
Crain, N. and K. Law. 2018. “The Bright Side of Fair Value Accounting: Evidence from Private Company Valuation. Available SSRN:
https://ssrn.com/abstract=3040396 or http://dx.doi.org/10.2139/ssrn.3040396
Sharpe, W. F. 1988. “Determining a Fund’s Effective Asset Mix.” Investment Management Review (September/October): 16–29.
——— . 1992. “Asset Allocation: Management Style and Performance Measurement.” Journal of Portfolio Management Winter: 7-19.
Sullivan, R.N. 2021. “Hedge Fund Alpha: Cycle or Sunset?” The Journal of Alternative Investments, Winter 23(3): 55-79.
[1] Ben-David et al. (2023), p. 1.
[2] Asness (2018) shows that hedge fund performance “petered out” after the GFC. Sullivan (2021) describes a significant reduction in active risk among hedge funds after the GFC.
[3] See Sullivan (2021), p. 61.
[4] Prior to 2009, there was no requirement to incorporate principles of market pricing in the valuation of private assets. Accordingly, cost, or another form of book value, prevailed in valuing private assets. That changed with the advent of Accounting Standards Codification (ASC) 820 in 2008, which required use of a market basis in valuing private assets. Crain and Law (2018) find that “…after the use of fair value accounting, fund managers more frequently revise their valuations down and lower the magnitude of upward valuation across all quarters.” They find that “valuation bias” is greatly reduced subsequent to the advent of ASC 820.
[5] See Bollen, et al. (2021).
[6] The benchmark is derived using returns-based style analysis (see Sharpe, 1988 and 1992.) It comprises 24% of the Russell 3000 stock index, 28% of the MSCI ACWI ex-US stock index (combination of hedged and unhedged series), and 48% Treasury bills.
[7] Antti Ilmanen observes that others have produced results that differ from these, with less equity exposure in the benchmark. (See, for example, Sullivan 2021.) This underscores the complexity and imprecision of this type of work. The results are dependent on a number of factors, including the source of hedge fund returns, time period, use of monthly or annual returns, whether constrained multiple regression (quadratic programming) or CAPM is used in constructing benchmarks, market index(es) used as independent variable(s), etc.
[8] We omitted returns for 2022 and 2023, which reflect significant return smoothing. The US stock market declined sharply in the fourth fiscal quarter of 2022. The net asset values (NAVs) used in valuing institutional fund returns at year-end 2022 did not reflect the decline in equity values owing to the practice of using NAVs lagged by one or more quarters in portfolio valuations. The equity market rose sharply the following year, and once again marks for private assets lagged as NAVs were beginning to reflect the prior downturn. The overall effect was to sharply attenuate losses in reporting for 2022 and tamp down gains in 2023. It will take at least through 2024, and possibly 2025, before these effects wash through the valuation process.
[9] Investors can, of course, use derivatives to control equity exposure apart from the policy (asset class) allocation, but this involves greater complexity and cost.
[10] Exhibit 3 is a theoretical construct for illustration purposes. It assumes that each actively managed account is equal in dollar value; that active risk for each of them is 5%; and that active risk among managers is uncorrelated.

