What the Stock Market Can Teach Us About Private Equity
CO-AUTHORED WITH DANIEL RASMUSSEN
Most studies of private equity performance rely on cash flows and net asset values (NAVs).[1] A few incorporate secondary-market pricing of private equity transactions.[2] This is the first study, to our knowledge, that evaluates the performance of private equity through the lens of listed private equity interests, making it an advance in private equity research.
We report that the volatility and stock market correlation of listed private equity (LPE) returns are greater than when determined using NAVs. Discounts from NAV that routinely arise in the trading of LPE shares are greater and more volatile than those reported in the secondary market. LPE has underperformed the public market for at least the last 20 years. Performance has been especially weak since the Federal Reserve started raising interest rates in 2022.
LISTED PRIVATE EQUITY FUNDS
The field of private equity funds is vast and diverse. There are 18,000 funds with more than $5 trillion in assets.[3] The great majority of assets are held in unlisted limited partnerships. There are many fewer listed funds. Some LPE tallies include venture capital and private debt, as well as public corporations active in various aspects of private market investment. Bilo et al. (2005) identify 287 such LPE firms. The S&P Listed Private Equity Index includes approximately 85 companies, primarily in Europe and North America, with an aggregate value of approximately $800 billion.[4] Private equity investment management and operating companies — private equity and credit businesses, as it were — such as Apollo, Blackstone, Brookfield, and KKR, make up the lion’s share of the value of the S&P LPE index.
We focus on a narrower slice of LPE funds. These are portfolios of private equity fund interests listed on various European stock exchanges. They are closed-end funds. These are “pure” private equity (buyout) plays, with both NAVs and market prices available on a daily basis. These fund interests are typical of the private equity investments made by institutional investors, such as pension funds and endowments.
The first part of this paper builds on Rasmussen and Grinstead (2025). Using a sample of 10 funds listed on the London Stock Exchange, Rasmussen and Grinstead estimate the volatility of LPE and its correlation with publicly traded stocks. They also analyze the discounts from NAV for LPE funds. The second part of the paper concerns the performance of LPE. That material is based on a universe of 29 LPE funds maintained by Finominal.[5]
By no means is this a comprehensive review of private equity (buyout) investing — far from it. We focus on the effects of bringing auction-market pricing to bear on a form of investment that has become a significant part of institutional portfolios — the leveraged buyout. The study is the first of its kind and involves a relatively small sample of funds. We hope that it provides a glimmer of insight into the latent market-valuation of private equity.
FINDINGS OF RASMUSSEN AND GRINSTEAD
Volatility
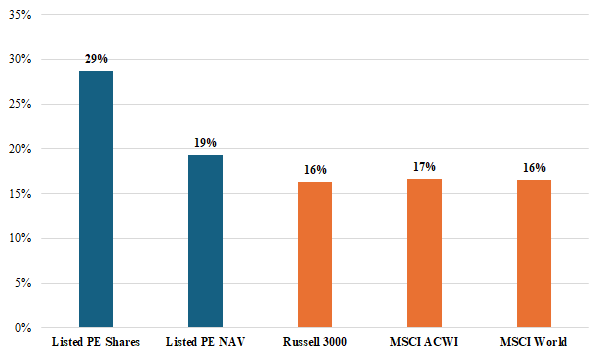
Asness (2023) aptly describes the valuation of private equity interests as “volatility laundering.” It is no secret that the customary valuation of private equity interests, based on NAV, understates the volatility of reported private equity values and returns. Rasmussen and Grinstead calculate the market-cap weighted volatility (standard deviation of annual return) of LPE, comparing it with stock market volatility. See Exhibit 1. NAV volatility is slightly greater than that of publicly-traded stocks. The volatility of the listed private equity funds at market, however, is much greater than that of stocks. This volatility differential is typically ignored in studies of the performance of private equity. We address this issue squarely later in the paper.
Exhibit 1
Annualized Volatility Comparison
(June 30, 2005–2025)
Following Rasmussen and Grinstead (2025)
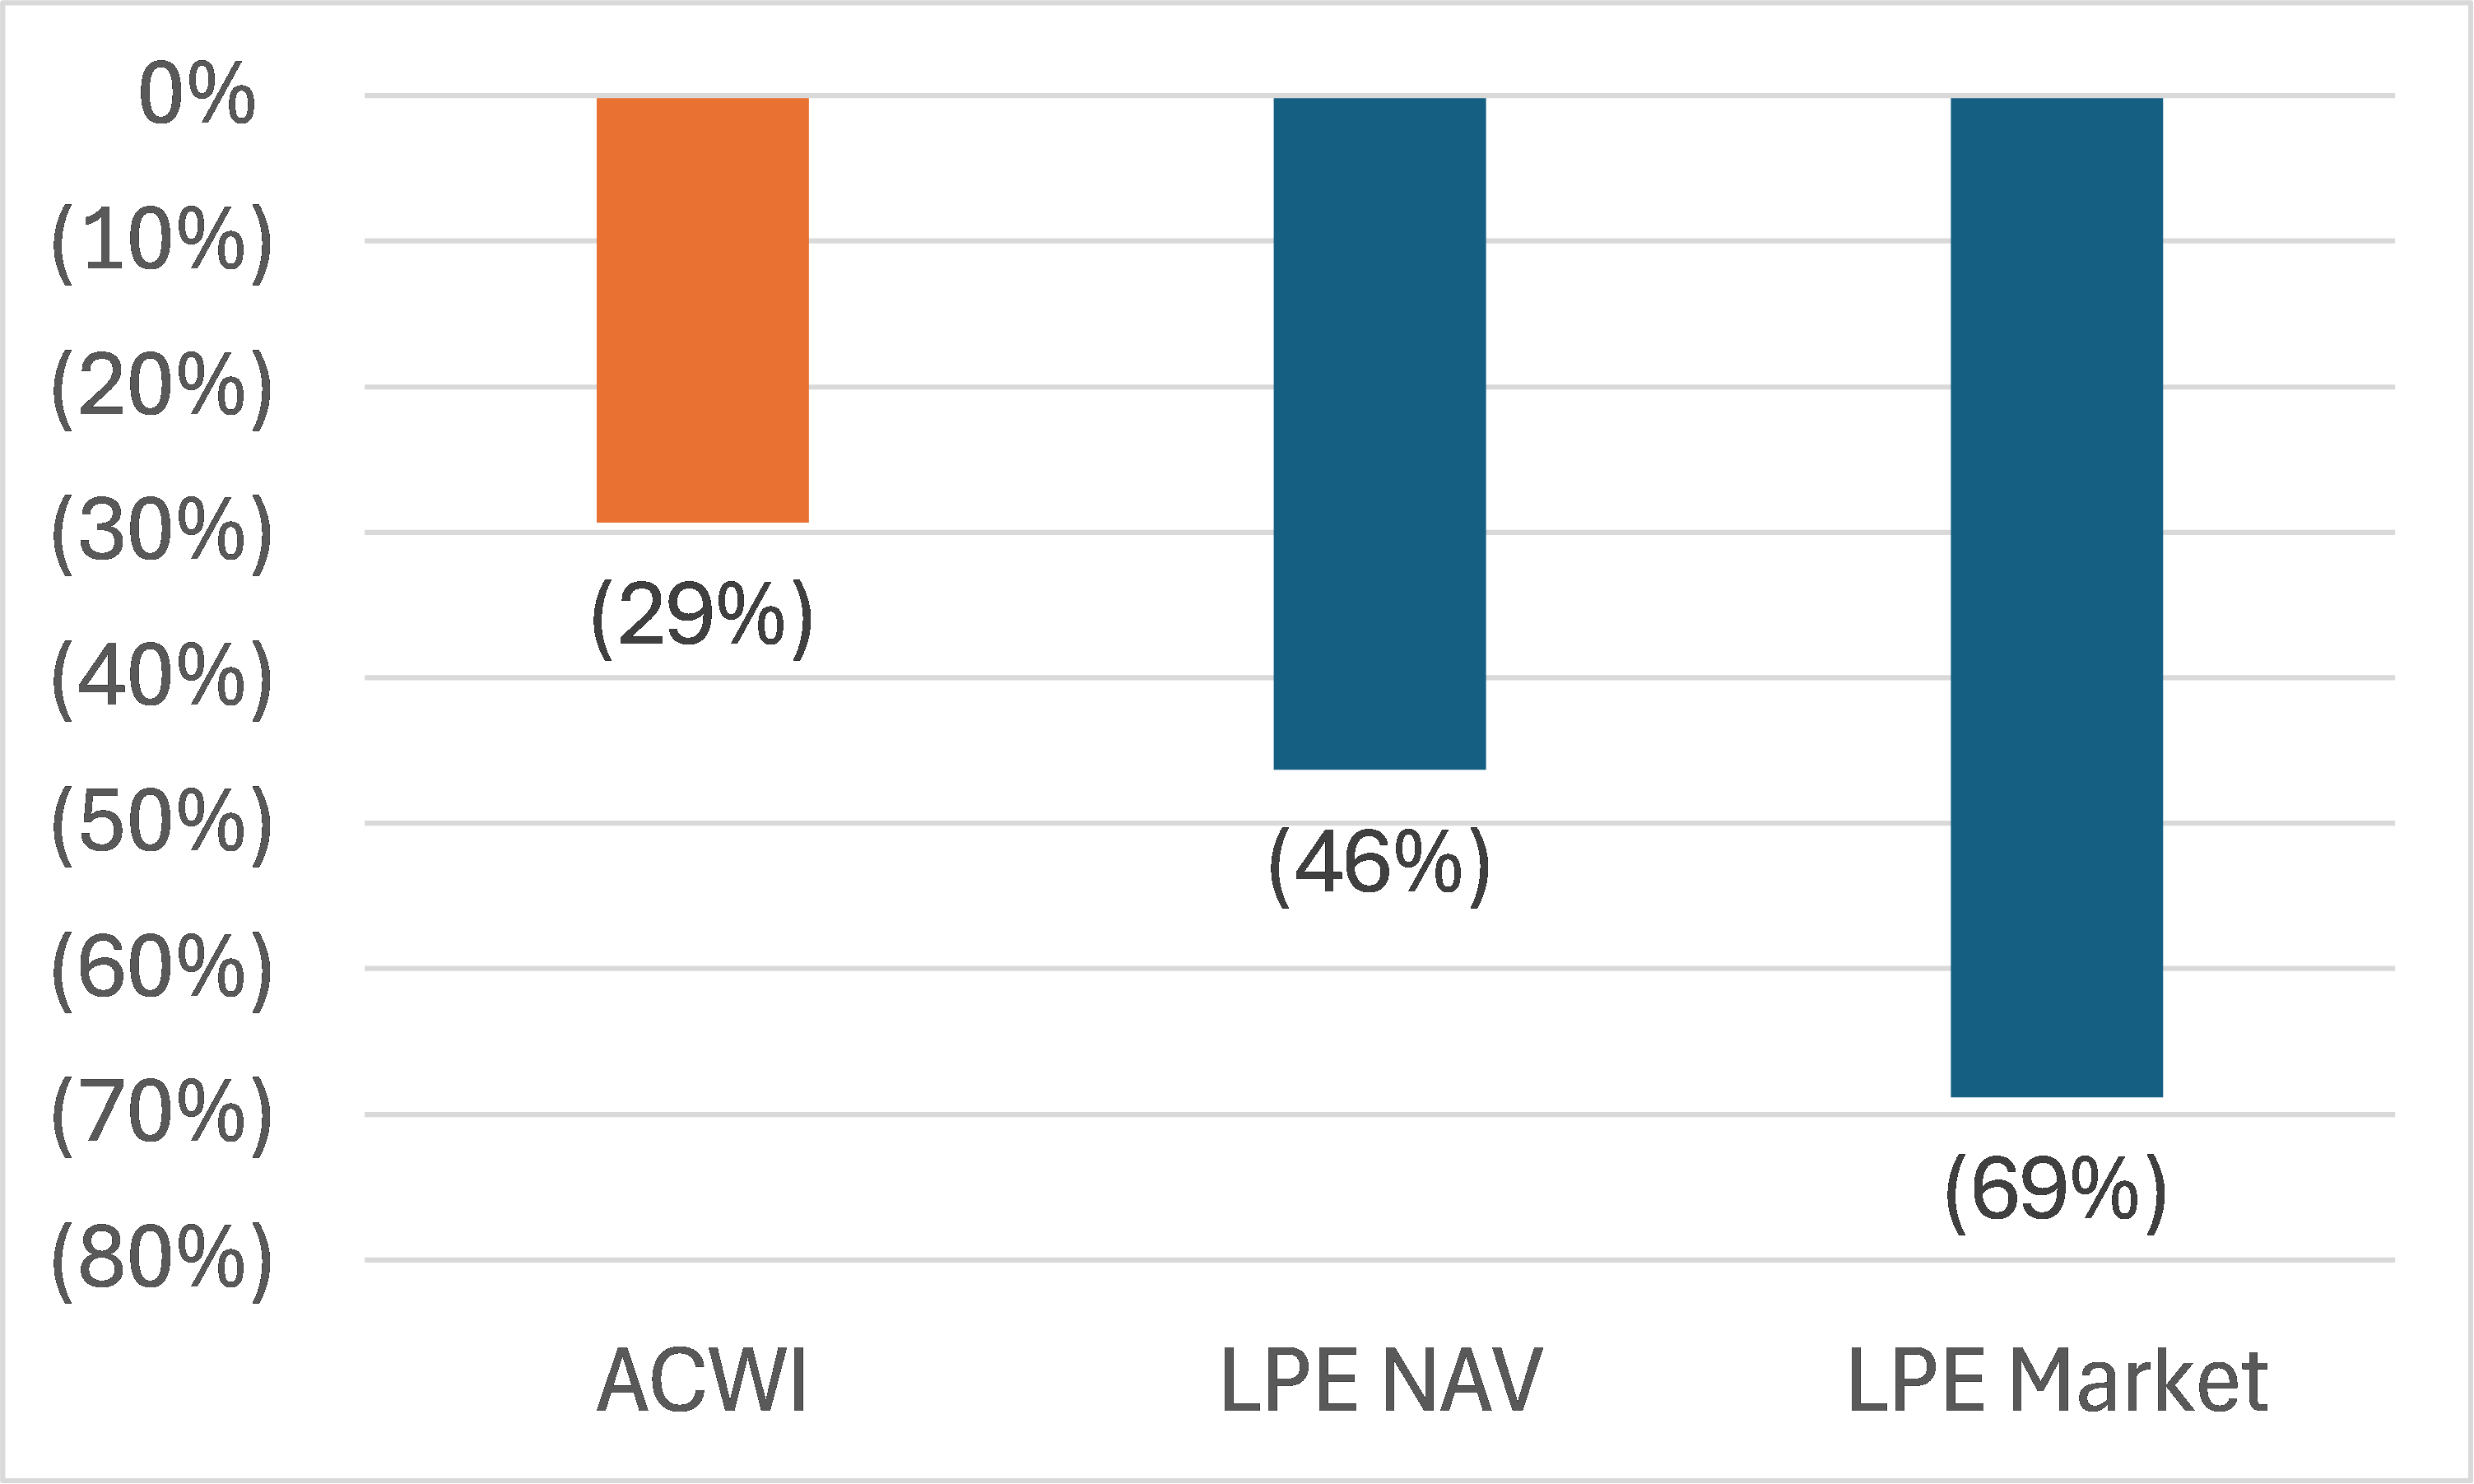
While volatility is a primary consideration in risk management, some investors find thinking in terms of drawdowns more tangible. Here again, we see that the drawdowns in the NAVs are significantly understated relative to the drawdowns in the LPE funds at market. Exhibit 2 shows the returns for the year ending June 30, 2009, for the LPE index, the LPE NAVs, and the MSCI ACWI. The LPE index had 2.4 times the drawdown of ACWI, a result consistent with the difference in volatility.
Exhibit 2
Returns for Year Ended June 30, 2009
Following Rasmussen and Grinstead
Correlation
Institutional investors tend to treat private equity as an alternative asset class distinct from public equity. LPE is more highly correlated with public equities than are private equity NAVs. For the 20 years ended June 30, 2025, the LPE index exhibited correlation of 0.94 with ACWI compared with 0.81 between its NAV and ACWI. The diversification benefit of private equity is slight.
Valuation
Rasmussen and Grinstead also analyze the volatility of the ratio of market value to NAV, sometimes referred to as the private equity discount. These discounts have been long noted and studied. Possible explanations for them relate to investor sentiment, illiquidity, information asymmetry, and systematic risk. See, for example, Lahr and Kaserer (2010).
Exhibit 3 shows the variation in NAV discounts based on market pricing of LPE interests as well as secondary-market pricing for the most recent 10 years. The blue line indicates market pricing based on the LSE sample of funds. (The series is market-cap weighted.) The red line shows secondary-market pricing according to Jefferies’s Private Capital Advisory group.[6] Reported secondary-market pricing differs from public-market pricing in two ways. First, the average NAV discount for secondary buyout transactions is rarely greater than 10%. The average discount for market pricing is ~20%, in a range of 10% to 35%. Second, the variability of market-based discounts is much greater than for the secondary market.
Exhibit 3
Discount to NAV for Listed Private Equity and Secondary Market Transactions
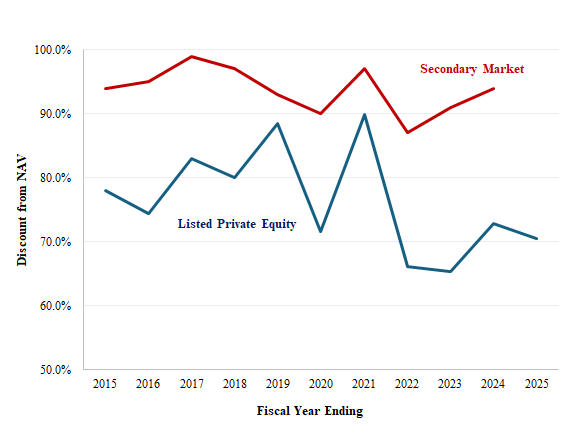
Sources: Jefferies; Rasmussen and Grinstead
There is reason, beyond what the data indicate, to believe that the secondary market provides a misleading picture of private equity valuation. Insiders to secondary market activity speculate that LPs prefer to minimize the discount associated with their transactions. (The motivation may be economic or window dressing.) Hamilton Lane emphasizes that sellers — especially seasoned institutional LPs — deploy various negotiation strategies and may restrict deal participation to select buyers to obtain the best price possible or reduce the size of the discount.[7] And, of course, sellers decide which assets to offer. So, while secondary market transaction data do offer an indication of the value of unlisted private equity funds, the data may present a biased picture of latent market pricing of private equity interests.
Dissatisfaction with NAVs has led to suggestions that private equity valuation begin to give consideration to secondary-market pricing. While that is a step in the right direction, these results indicate that the scope of the valuation problem may be much larger than is commonly believed to be the case. Secondary-market discounts may be just the tip of the mis-valuation iceberg.

This has become an especially important issue for investors with large allocations to private assets, e.g., the Ivy League Schools and other, similar private institutions. Many are facing an acute financial squeeze. Some are selling endowment assets and borrowing to finance their operations. As for the asset sales, the institutions need the cash. At the same time, endowment managers are reluctant to reveal that assets on the books are worth significantly less than their stated value. No doubt they are being selective in deciding which assets to sell and how to structure their offerings to minimize the discounts from NAV they will inevitably have to report.
PERFORMANCE
Listed Private Equity Return Data
Efforts to evaluate the performance of private equity have been frustrated by the absence of market values. Analysts have had to work with cash flows, IRRs, and NAVs. True, time-weighted returns have only recently become available.
Finominal is a leading provider of fund returns and investment portfolio analytical tools. It introduced its Private Equity Index (FPEI) in 2025.[8] The Index is based on a universe of 29 funds listed on various European stock exchanges, with return histories dating back to the 1980s. The aggregate market capitalization is $19.4 billion. See Exhibit 4. These are closed-end funds comprising mainly buyout partnership interests, similar to those of pension funds and endowments. This universe is broader than the Rasmussen and Grinstead sample and is publicly available. We use FPEI in the evaluation of LPE performance that follows.
Exhibit 4

The number of listings belies the breadth of private equity investment activity represented by these funds. Several of them are funds of funds that invest in large numbers of separate private equity funds. These constituent funds hold more than 2,000 individual portfolio companies diversified by geography, sector, vintage, and size. The HarbourVest fund alone invests in 63 of its own funds of funds. These vehicles have commitments to more than 1,000 portfolio companies in underlying private equity funds managed by many different external fund managers. To appreciate the representativeness of this microcosm of private equity, we need to focus on the assets, not merely the number of “wrappers.”
The FPEI is a market-cap weighted index of the returns of the funds in Exhibit 4, including the non-survivors.
Market Index
We use the MSCI World Index as the benchmark for performance measurement. The logic is as follows: First, over the last 25 years, the geographic breakdown of buyout investments has been roughly 60% US, 40% non-US. In recent years, the majority of LPE assets have been invested outside the US. [9] These facts do not justify excluding non-US stocks in favor of a US-only index like Russell 3000. So, we select a global index. Second, there has been comparatively little buyout activity in emerging markets. For this reason, we favor MSCI World over ACWI, which currently includes a 10% allocation to emerging markets.
Return Comparison
Exhibit 5 compares the annual rate of return of FPEI with that of the MSCI World Index over various periods. It shows that private equity investments, as proxied by FPEI, have had a similar return to that of global stocks. The annualized differences between the two series have been fairly small: -2.0% to 0.4%. However, the volatilities of the two series differ greatly. The volatility of FEPI for the 20 years of this study is 27.4%. The figure for MSCI World is 16.5%. In the next section, we evaluate the returns of FEPI taking account of the difference in volatility.
Exhibit 5
Annual Rates of Return
|
Years Ended June 30, 2025 |
FPEI |
MSCI World |
Difference |
|
5 |
14.2% |
14.6 |
-0.4% |
|
10 |
8.7 |
10.7 |
-2.0 |
|
15 |
11.9 |
11.5 |
0.4 |
|
20 |
6.8 |
8.5 |
-1.7 |
A harbinger? It is worth noting that LPE significantly underperformed the stock market once the Federal Reserve began hiking interest rates in 2022. LPE underperformed the MSCI World Index by an average of 6.9 percentage points per year during those three years. See Exhibit 6. Could this be an indication of what’s to come for private equity now that the Fed’s zero-interest-rate policy (ZIRP) has ended?
Exhibit 6
Return Comparison Post-ZIRP
|
Years ended June 30 |
FPEI |
MSCI World |
Difference |
|
2023 |
7.5% |
18.5% |
-11.0% |
|
2024 |
12.5 |
20.2 |
-7.7 |
|
2025 |
14.4 |
16.3 |
-1.9 |
Risk-Adjusted Return
We use the capital asset pricing model (CAPM) to evaluate the performance of the FPEI. Exhibit 7 illustrates regression of the excess annual returns (risk premiums) of the FPEI on those of the MSCI World index over 20 years. (The choice of differencing interval turns out to be critically important. See Appendix.) The FPEI beta of 1.6 indicates that the systematic volatility of publicly traded private equity was 60% greater than that of the market as a whole. This is consistent with private equity’s greater use of leverage relative to publicly-traded companies.[10] Capturing the full impact of leverage in evaluating private equity performance has been largely absent in prior studies. Risk-adjusted performance, or alpha, is -4.2%, annualized, with a not-significant t-statistic of -1.7.
Exhibit 7
Annual FPEI Risk Premiums Regressed on those of MSCI World Index Risk Premiums
(20 years ended June 30, 2025)
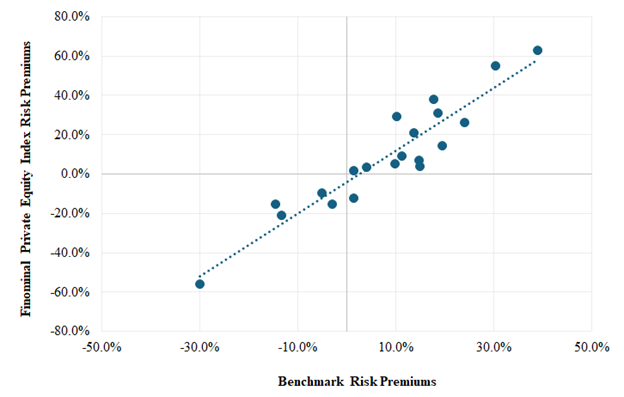
The R2 of FPEI with the MSCI World Index is 88%, evincing the strong connection between private equity and publicly traded stocks when private equity is valued in economic, rather than accounting (NAV), terms.
Exhibit 8 reports on the risk-adjusted performance of the FPEI over various periods. It shows a consistent pattern: Beta is ~1.6. Alpha ranges from -4% to -6%. (None of the alphas is statistically significant.) R2 is consistently above 80%.
Exhibit 8
CAPM Performance Statistics
|
Years Ended June 30 |
Beta |
Alpha |
R2 |
|
5 |
1.4 |
-5.0% |
85% |
|
10 |
1.6 |
-6.4 |
83 |
|
15 |
1.6 |
-5.1 |
86 |
|
20 |
1.6 |
-4.2 |
88 |
We divided the 20-year return history of FPEI into four nonoverlapping periods looking for evidence of endpoint bias or instability. See Exhibit 9. These regressions (of total return rather than risk premiums for the sake of simplicity) of FPEI on MSCI World Index are broadly consistent with the results shown in Exhibit 8, revealing no evidence of endpoint bias. Note that these are short sub-periods, just five years in duration. And returns are annual. This is a sturdy, if imperfect, little model.
Exhibit 9
Non-Overlapping Regressions
|
Segment of 20 Years |
Beta |
Intercept |
R2 |
|
First Five Years |
1.6 |
-3.6% |
89% |
|
Second Five Years |
1.6 |
-1.8 |
93 |
|
Third Five Years |
2.5 |
-13.2 |
91 |
|
Fourth Five Years |
1.3 |
-5.0 |
82 |
To further explore the possibility of endpoint bias or instability, we look at rolling 10-year regressions that advance the endpoint a year at a time. See Exhibit 10. The key regression parameters are stable, with the intercept in the range of -2% to -6%.
Exhibit 10
Rolling Decades of FPEI Performance
|
Decade Ended June 30 |
Beta |
Intercept |
Intercept t-statistic |
R2 |
|
2015 |
1.5 |
-2.6% |
-0.9 |
94% |
|
2016 |
1.5 |
-3.6 |
-1.3 |
94 |
|
2017 |
1.6 |
-2.4 |
-0.8 |
93 |
|
2018 |
1.7 |
-6.1 |
-2.3 |
95 |
|
2019 |
1.6 |
-3.4 |
-1.0 |
90 |
|
2020 |
1.6 |
-4.2 |
-1.4 |
91 |
|
2021 |
1.5 |
-3.8 |
-1.3 |
93 |
|
2022 |
1.4 |
-2.7 |
-0.9 |
92 |
|
2023 |
1.4 |
-3.8 |
-1.1 |
89 |
|
2024 |
1.4 |
-4.2 |
-1.2 |
88 |
|
2025 |
1.4 |
-4.9 |
-1.4 |
88 |
A study similar to ours in terms of design and execution is the academic work of Boyer et al. (2023). They evaluate the performance of private equity (buyouts) as realized via secondary-market transactions. They use a total US stock market benchmark. They create a private equity index spanning the years 2006 to 2018. They observe a beta of 1.8 for buyouts and an insignificant alpha of -2.0%. Annual volatility is 34%, and correlation with the market is 0.83 (R2 of 69%). Exhibit 11 shows that we are in the same ballpark as Boyer et al.[11]
Exhibit 11
Summary Statistics for Traded Private Equity Interests
|
|
Boyer et al. (2023) |
Finominal Private Equity Index |
|
Study Period |
2006 - 2018 |
20 Years Ended 6/30/25 |
|
Venue |
Secondary Market |
Various Stock Exchanges |
|
Volatility |
34% |
27% |
|
Beta |
1.8 |
1.6 |
|
Alpha |
-2.0% |
-4.2% |
|
R2 |
69% |
88% |
Summing Up Risk-Adjusted Performance Discussion: The FPEI has underperformed the stock market in risk-adjusted terms. The CAPM beta is 1.6, and alpha is -4.2% per year with the global equity market index over 20 years. The negative alphas may be the most striking result we report. Here, there are two things to keep in mind. One is that this may be the first discussion of private equity performance you have seen that requires that market risk be fully compensated before declaring a profit on the investment. Second, estimates of the cost of private equity investing (buyouts) are in the range of 6% to 8% of asset value per year.[12] In this light, a seemingly large negative alpha, which can be thought of as fee drag, isn’t really surprising at all.
CONCLUSION
The market pricing of private equity interests as observed on European stock markets provides an opportunity to improve our understanding of private equity’s latent volatility, pricing and performance. Private equity is more volatile than commonly thought. Public-market volatility greatly exceeds NAV volatility. Institutional investors could be underestimating the risk of their private equity portfolios. Our research also suggests that private equity is more highly correlated with public equity markets than NAVs would imply, suggesting that overall portfolio risk calculations might be understated to the extent investors are relying on private equity to be a diversifier.
The market pricing of private equity relative to NAV is well below that indicated by secondary-market transactions and varies much more widely. This raises a question about the usefulness of the secondary market as an indicator of fluctuating private equity market value. It also illustrates a conundrum for institutions with large allocations to private assets that need to raise cash. Selling private assets in the secondary market reveals that remaining assets are likely being valued in excess of their fair market value. LPE’s beta of 1.6 accords with private equity’s greater leverage compared to that of public companies. LPE has underperformed the stock market for the last 20 years. Performance has been especially weak since the Federal Reserve began raising interest rates in 2022.
ACKNOWLEDGEMENTS
We gratefully acknowledge helpful comments of Andrew Ang, Gregory Brown, Antti Ilmanen, Steven Kaplan, Ludovic Phalippou, Nicolas Rabener, Trym Riksen, William Sharpe, and William Volckmann.
APPENDIX: THE DIFFERENCING INTERVAL
We use annual differencing in regressing FPEI returns on those of the MSCI World index. A seminal paper on this issue, Greene and Fielitz (1980), shows that the choice of differencing interval in the analysis of investment returns should be influenced by: (1) the relevant investment horizon and (2) properties of the data under study. G&F maintain that there is no simple default position, e.g., favoring monthly returns because it is the most common practice.
Our goal is to evaluate the long term — 20-year — performance of LPE as represented by the FPEI, which is to say the relevant horizon is many years. This differs from, say, a goal of developing a short-term trading strategy for liquid securities. In the latter case, daily differencing might be best to benefit from the granularity that is absent in longer intervals. On the other hand, a long differencing interval provides greater opportunity for random short-term fluctuations to average out, with possible loss of model strength as a result of there being fewer observations.
The FPEI comprises small- and micro-cap stocks. These trade thinly, and they have missing prices and pricing gaps. Thus, the data quality of FPEI is not the same as that of a large-cap stock index. This shows up as noise when regressing FPEI returns on those of the MSCI World index. We demonstrate below that it can take up to two years for random return effects to wash out of a regression involving FPEI returns.
These facts indicate that a long differencing interval is better than a short one for our purposes.
We examine regression results using daily, monthly, annual and biennial differencing intervals. Exhibit A1 summarizes the results. It compares 20-year regression results for the four intervals. Increasing the interval from daily to monthly to annual has a significant effect on the regression parameters, namely, slope (beta) and intercept. Beta rises from 0.4 to 1.5, and the intercept decreases from zero to -3.8% annually. The power of the regression, as measured by R2, also increases dramatically, from 23% to 91%. Using biennial differencing doesn’t alter beta or intercept much. But it does further increase R2 — from 91% to 97% — strengthening the model considerably, with noise, measured by unexplained variance, decreasing by two-thirds, from 9% to 3%. As noise is further reduced, a statistically significant intercept emerges, i.e., approximately -5% over two years, or about -2.5% annualized.
Exhibit A1
The Impact of Varying the Differencing Interval
(20 years ended June 30, 2025)
|
|
Daily Returns |
Monthly Returns |
Annual Returns |
Biennial Returns |
|
Annualized Volatility of FPEI |
16.3% |
19.5% |
27.5% |
28.6% |
|
Correlation with MSCI World Index |
0.48 |
0.78 |
0.96 |
.99 |
|
Beta |
0.40 |
0.89 |
1.47 |
1.51 |
|
Intercept |
0.02% |
0.03% |
-3.83% |
-4.99% (~ -2.5% annualized) |
|
t-Statistic of Intercept |
1.3 |
0.0 |
-1.8 |
-3.6 |
|
R2 |
23% |
60% |
91% |
97% |
|
Noise (Unexplained Variance as a Percentage of Total Variance) |
77% |
40% |
9% |
3% |
A case can be made for the use of biennial returns in our 20-year study of LPE performance. We settle, however, on the use of annual returns with the notion that doing so may better balance sample size and noise reduction.
REFERENCES
Asness, C. 2023. “Volatility Laundering.” AQR Capital Management. https://www.aqr.com/Insights/Perspectives/Volatility-Laundering
Bilo, S., H. Christopher, M. Degosciu, and H. Zimmermann. 2005. “Risk, Returns, and Biases of Listed Private Equity Portfolios.” University of Basel, WWZ/Department of Finance, Working Paper No. 1/05.
Boyer, B. H., T.D. Nadauld, K. Vorkink, and M. Weisbach. 2023. “Discountâ€Rate Risk in Private Equity: Evidence from Secondary Market Transactions,” The Journal of Finance 78, 835–885.
Gensler, G. 2021. Testimony Before the Subcommittee on Financial Services and General, U.S. Government, U.S. House Appopriations Committee. At https://www.sec.gov/newsroom/speeches-statements/gensler-2021-05-26.
Godwin, A. 2022. "Estimating Illiquid Asset Class Alpha and Beta using Secondary Transaction Prices." MPRA Paper 112510, University Library of Munich, Germany.
Greene, M.T. and B.D. Fielitz. 1980. “Long-Term Dependence and Least Squares Regression in Investment Analysis.” Management Science, Vol. 26, No. 10.
Harris, R.S., T. Jenkinson, S.N. Kaplan, and R. Stucke. 2023. “Has Persistence Persisted in Private Equity? Evidence from Buyout and Venture Capital Funds.” Journal of Corporate Finance, Volume 81.
Jefferies Private Capital Advisory. January 2021 and 2025. “Global Secondary Market Review.”
Jenkinson, T., H. Kim, and M. Weisbach. 2021. “Buyouts: A Primer.” NBER Working Paper No. w29502, Available at SSRN: https://ssrn.com/abstract=3968725.
Hamilton Lane, "The Truth About Secondaries: Separating Myth from Market Opportunity," July 16, 2025.
Lahr, H. and C. Kaserer. 2010. “Net Asset Value Discounts in Listed Private Equity Funds.” CEFS Working Paper No. 2009-12, Available at SSRN: https://ssrn.com/abstract=1494246
or http://dx.doi.org/10.2139/ssrn.1494246.
Lim, W. 2024. “Accessing Private Markets: What Does It Cost?” Financial Analysts Journal, 80(4), 27–52.
Phalippou, L., and O. Gottschalg. 2009. “The Performance of Private Equity Funds.” The Review of Financial Studies 22 (4): 1747–1776.
Rasmussen, D. and J. Grinstead. 2025. “When Private Funds Are Publicly Traded.” Verdad.
Scharf, D. 2021. ”GP-Led Transactions: What LPs Need to Know.” Hamilton Lane,
September 23.
S&P Dow Jones Indices. “S&P Listed Private Equity Index.” July 31, 2025. At
https://www.spglobal.com/spdji/en/idsenhancedfactsheet/file.pdf?calcFrequency=M&force_download=true&hostIdentifier=48190c8c-42c4-46af-8d1a-0cd5db894797&languageId=1&indexId=92479391.[1] NAV is the value of an investment fund’s assets minus its liabilities as determined by the manager of the fund.]
[2] See Godwin (2022) and Boyer et al. (2023).
[3] See Gensler (2021).
[4] S&P Dow Jones Indices (2025).
[5] All results are stated in US dollar terms.
[6] The data are not strictly comparable. The LPE data are at a point in time and the secondary market data are the average over time.
[7] See Hamilton Lane (2025) and Scharf (2021).
[8] The FPEI is available at https://finominal.com/asset-comparer-analyze/1/US/FPEIUS/1986-06-25/2025-08-12
[9] Courtesy of the Institute of Private Capital, Kenan-Flagler Business School, University of North Carolina at Chapel Hill.
[10] LBO debt has typically amounted to 60-70% of asset value at acquisition. The debt of ACWI companies is in the range of 20-30% of assets. Boyer et al. (2023) estimate the beta of private equity to be 1.8 based on secondary market pricing relative to the S&P 500.
[11] We also analyzed the CAPM performance of FPEI using the Russell 3000 stock index. This results in a deterioration in performance. The beta of 1.6 is the same as reported in Exhibit 8 for MSCI World. R2 declines to 84% from 88%. Alpha declines to -6.2% with a t-statistic of -2.0.
[12] See Phalippou and Gottschalg (2009), Jenkinson et al. (2021), and Lim (2024).

