The Demise of Alternative Investments
Building out alternative investment portfolios has occupied the main stage of institutional asset management for a quarter of a century. Real estate, venture capital, private equity, and hedge funds were the early attractions. Private credit, infrastructure, and energy investments caught on more recently. Currently, 35% of public pension assets are alternatives.[1] The figure for large endowment funds is 65%.[2] “Alts,” as alternative investments are sometimes called, supposedly offer attractive returns and diversification, buffering investors from the vagaries of the stock market. Surveys indicate that institutional investors plan to continue adding to their alts portfolios.[3] Alts are widely assumed to figure prominently in the future of institutional asset management.
I disagree.
Alts cost way too much for what you get. It’s that simple. We have it on good authority from the godfather of alts-investing, the distinguished David F. Swensen of Yale University.[4] In a ProPublica interview in 2009, Swensen said:
[T]here's a vanishingly small number of… [investors like Yale]. Those on the passive end of the spectrum have figured out that they don’t know enough to be active. The passive group is not nearly as big as it should be. Almost everybody should be there….
When you pay out a point and a half or two points or two and a half points, and you give away 20 percent of the gains, that gets extracted from you the investor. If you're in an index fund, you're paying a tenth of a percent and no percentage of the profits. But the assets that you get when you index are pretty much like the assets that you're invested in with all these fancy fee schemes. So, it's just basic arithmetic. It's not complicated.[5]
I begin this critique of alts for the long run with a look at the cost of alts-investing. Then I briefly summarize the scholarly literature evaluating alts’ performance. Following that, I introduce a novel framework for understanding how allocating to alts affects institutional portfolio performance. Next, I explain why alts-investing has gotten as far as it has for as long as it has. Finally, I conjecture on how institutional fund management will eventually right itself.
THE COST OF ALTS-INVESTING
My thesis is that wholesale alts-investing will not survive in the long run because it is costly and wasteful. Sooner or later, this will sink in on institutional trustees. As Swensen noted, what you get with alts is pretty much the same as what you get with stocks and bonds. The main difference is that you pay at least 10 times as much for the alts.
Lim (2024) provides a comprehensive analysis of the cost of private asset investing. The source of the data is a large, unidentified advisor to limited partner (LP) investors. The advisor assembled the dataset over time as part of general partner (GP) due diligence. The study is unusual for the breadth and depth of the data. It includes 10,791 funds in 10 private markets. It spans the vintage years 1969 to 2020.
Exhibit 1 summarizes Lim’s cost estimates for eight areas of private market investment. Cost figures include management fees and carry revenue of the GP, expressed as a percentage of asset value. The table reports the differences between the median gross- and net-of-fee IRRs for each asset class, which is described as “fee drag” on annualized return. IRRs are calculated over the life of each fund. The author generalizes that the cost of private market investment falls in the range of 5% to 8% per year over the life of the investment.
Exhibit 1
Estimated Cost of Private Market Investments
|
Asset Class |
Difference Between Median Gross and Net IRRs |
|
Buyouts |
7.9% |
|
Venture Capital |
8.5 |
|
Energy |
7.3 |
|
Infrastructure |
5.1 |
|
Natural Resources |
5.3 |
|
Core-Plus Real Estate |
4.7 |
|
Non-Core Real Estate |
7.3 |
|
Direct Lending |
5.0 |
Source: Lim (2024)
These are among the highest cost estimates for private assets reported in the literature. For example, Phalippou and Gottschalg (2009) estimate the cost of buyout funds at 6% per year. Cambridge Associates (2020) cites an average figure of 6.6% for private equity (1986-2014). Jenkinson et al. (2021) report a figure for buyouts of 6%. Bollinger and Pagliari (2019) estimate the annual cost of non-core real estate at 3% to 4% of equity value. A Cliffwater (2024) survey of the cost of direct lending reports an average all-in cost of 4.1%. Nevertheless, Lim’s cost estimates are in the same ballpark as other reported figures for private assets.
A Fisher College of Business working paper provides a recent look at the cost of hedge funds. The paper, Ben-David, Birru, and Rossi (2023), analyzes approximately 6,000 hedge funds by combining two commercial databases. One is BarclayHedge. The other is the Lipper Trading Advisor Selection System (TASS). Ben-David et al. provide an interesting and important insight: Hedge funds’ “2-and-20” adds up to more than 2 and 20. They estimate the effective incentive rate is 50%, which is 2.5 times greater than the nominal 20% figure. The authors say, “This happens because about sixty percent of the gains on which incentive fees are earned are eventually offset by losses.” They calculate an average annual total cost of 3.44% of assets under management for the hedge fund industry between 1995 and 2016.
I identified a few public pension plans that appear to report fully on their investment expenses — management fees plus carry. See Exhibit 2. Those with significant alts exposure (eight of the nine) reported an average total cost (expense ratio) of 1.5% of asset value. I devised a simple model using these data to gauge the cost of managing institutional portfolios as a function of their aggregate allocation to alts. Although the model is based on a small sample and a single, rather coarse independent variable, it explains 65% of the variation in reported cost. Based on the model, the imputed cost of a typical diversified portfolio of alts (100% alts) is 3.6% of asset value per year with a standard error of 0.4%.[6] In light of the cost estimates for specific areas of alts described above and the small sample size here, I believe this is a conservative figure for the operating cost of a diverse portfolio of alts.
Exhibit 2
Alts Allocation and Cost for Nine Public Pension Plans
|
Pension Plan |
Allocation to Alts |
Estimated Reported Annual Total Cost |
|
1 |
0% |
0.1% |
|
2 |
29 |
1.5 |
|
3 |
30 |
1.1 |
|
4 |
38 |
1.9 |
|
5 |
38 |
1.9 |
|
6 |
39 |
1.2 |
|
7 |
43 |
1.6 |
|
8 |
43 |
1.0 |
|
9 |
49 |
2.0 |
Source: Ennis (2025a)
The cost of principal institutional investment options spans two orders of magnitude: from passive management at ~0.05% annually, to traditional assets at ~0.5%, to private assets at ~5%. So, the cost of private assets is ~100 times that of indexing.
ALTS’ PERFORMANCE, BRIEFLY
Evaluating the performance of alts is problematic. Valuing private assets is guesswork. GPs provide net asset values (NAVs), lagged by a quarter or more. The industry relies heavily on internal rates of return (IRRs) to gauge performance; valid time-weighted rates of return are not available. Hedge funds hold mostly publicly traded stocks but sometimes include semi-liquid positions. So, stale pricing can be a problem in getting valid returns for some hedge funds. An even bigger problem is compiling an unbiased sample of hedge funds, which are not regulated to the same extent as mutual funds. Indexes of alts returns are hypothetical and nebulous. None of them has been investable. With these reservations, my interpretation of the performance literature for the three most closely studied alternative investment types — what I call the Big Three — follows.
Real Estate (Private Equity)
There is extensive research dealing with the performance of private real estate equity. Virtually all of it shows that private real estate has significantly underperformed. The Cambridge Associates Real Estate Index earned 7.0% per year for the 25 years ended June 2024. The FTSE NAREIT Index earned 9.5% then. So, the private market real estate index trailed the public one by 2.5 percentage points per year over 25 years. Bollinger and Pagliari (2019), using Burgiss data, find that non-core real estate investments (which account for an estimated one-half of institutional real estate allocations), generated negative alphas of approximately three percentage points per year between 2000 and 2017. CEM Benchmarking compares the Sharpe ratios of various assets held by institutions. For the 25 years ended 2022, the Sharpe ratio of institutions’ listed real estate, at 0.39, markedly exceeds the 0.31 for unlisted real estate.[7] Andonov (2022) reports that between 1991 and 2017, the real estate component of funds monitored by CEM underperformed those funds’ equity benchmarks by an average of 2.9% per year. Riddiough (2022) charts US pension funds’ dismal experience with private equity real estate over several decades.
Hedge Funds
Hedge funds have not added value for institutional investors since the Global Financial Crisis of 2008 (GFC). For the 15 years ended June 30, 2023, the HFR Fund-Weighed Composite Index had an annualized return of 4.0%. This compares to a 4.5% return for a blend of public market indexes with matching market exposures and risk: namely, 52% stocks and 48% bills. So, the hedge fund industry composite underperformed by 0.5% per year, notwithstanding whatever selection and/or survivorship bias that may be present in the HFR data. CEM Benchmarking indicates a Sharpe ratio of 0.26 for institutional hedge fund investments between 1998 and 2022. This compares with 0.40 and 0.38 for US stocks and bonds, respectively, meaning the actual hedge fund investments of institutions have been especially poor performers over an extended period.[8] As for the recent scholarly literature on hedge fund performance, Sullivan (2021) reports that hedge fund alpha, after several years of being positive, went negative after the GFC. Bollen et al. (2021) reach the same conclusion.[9]
Private Equity
There is no easy answer when it comes to the question of how well private equity has performed. Performance measurement has two dimensions. One is return. The other is risk. We need to understand both to judge whether there is a return in excess of what the market delivers, and, if so, whether it is adequate for the risk.
There are many forms of private equity, including buyouts, venture capital, real estate, infrastructure, energy, natural resources, and various forms of “credit.” The following discussion focuses on buyouts, the largest segment of the private equity market, but the return and risk measurement issues are not much different in other areas.
Return. There are a number of different methods for gauging the return of buyouts. They include internal rate of return (IRR), multiple of money (MoM),[10] and public market equivalent (PME). PME is often used in performance evaluation in scholarly papers. PME indicates the amount of wealth generated by a private equity investment compared with a matching investment in a stock market index. PME is the ratio of discounted cash flows from the two alternatives, using the return of the stock index as the discount rate. A PME of 1.0 indicates the two produced the same present value of wealth for a given period, such as the life of a fund. A PME greater than 1.0 indicates greater value creation for the private fund, reckoned in present value terms.
Harris et al. (2023) report an average S&P 500-based PME of 1.18 for buyouts (vintage years 1987-2015). Kaplan (2023) updates Harris et al. through vintage year 2019 and finds an average PME of 1.18 post-GFC. Based on these results, buyouts generated cumulative returns (in present value terms) about 20% greater than the stock market broadly over the life of the funds.[11]
Risk. It is not clear how meaningful PMEs are for buyouts because they generally ignore the difference in risk between (leveraged) buyouts and S&P 500 companies. The greater gains achieved by buyouts cited in the preceding paragraph, for example, do not take into account the leverage-based difference in risk that exists between buyouts and the S&P 500. Boyer, Nadauld, Vorkink and Weisbach (2023), using secondary market pricing for buyouts, estimate that they have a beta of 1.8 and a not-statistically-significant alpha of -2%. The beta of 1.8 jibes with Modigliani and Miller’s Proposition 2 regarding the cost of equity capital being dependent on leverage.
The results are inconclusive for private equity performance. Buyouts, with a PME of 1.2, have generated returns 20% greater than public equity as measured by the S&P 500. However, a market beta of 1.8 for buyouts warrants a PME closer to 1.8 for risk and return to reconcile in terms of finance theory. So, while buyouts have done better than public equity in a tangible sense (greater realized return), they have not demonstrated that they even match public equity in the fuller context of risk-adjusted performance.
An authority on the expected return of risky assets, Antti Ilmanen, focuses on the outlook for buyout returns:
Triple tailwinds helped PE firms perform strongly for multiple decades -- a wide valuation gap between public and private markets, a long richening trend in assets PE firms lever, and very cheap leverage. Now all three tailwinds are gone. This means that PE firms must now earn their keep the hard way, by improving the companies they hold. Some can do it but can they collectively do it well enough to beat their still-high fees? Doubtful.[12]
ALTS’ IMPACT ON TOTAL PORTFOLIO PERFORMANCE
Framework and Methodology
My approach to evaluating alts’ impact on institutional performance is to examine how variation in their weight in portfolios affects the excess return of those portfolios.[13] I use this workaround owing to the absence of return histories for the alternative investments of institutional portfolios. Virtually all large institutional funds report the total rate of return for their portfolio annually. These figures are reasonably well vetted.[14] Accordingly, it is reasonable to create an historical annual return series at the total portfolio level. Public pensions’ reporting of asset class returns, however, is sketchy and more prone to inaccuracy than returns reported for the total portfolio. Endowments do not publish returns at the asset-class level. Thus, for practical purposes, there is no reliable source for asset-class-level return data for institutional investors.
So, we proceed to collect the historical allocation percentages of various categories of alts for each fund studied. The Boston College Center for Retirement Research (CRR)[15] provides such data for public pension funds. (There is no source for portfolio level allocation percentages for individual endowments.) The methodology is as follows:
- Create an equal-weighted composite of total portfolio returns.
- Determine the excess return for the composite and for each of the individual portfolios.
- Determine the average percentage allocation over time of each individual portfolio to alts — in the aggregate and by subcategory. This is the measure of exposure to alts.
- In cross section, regress excess return of individual funds on their average allocation to alts in the aggregate and for individual categories. This provides the sensitivity of excess return to variation in the exposure to alts.
Results
Total Fund. I acquire rates of return for a sample of 50 large US public pension funds for the 16 fiscal years ended June 30, 2024. CRR and the funds’ annual reports are sources. I include only funds reporting returns net of fees.
I then create an equal-weighted composite of fund returns. I also develop a Market Index to evaluate the performance of the composite. The Market Index has the same effective stock-and-bond market exposures and the same risk (standard deviation of total return) as the composite.[16] The Market Index blends returns of US and non-US stock indexes with those of an investment-grade US bond index to form a single, hybrid index.[17]
The public pension fund composite has an annualized return of 6.88% for the 16 years. The Market Index return is 7.84%. The difference between the two series, or annual excess return, is -0.96%, or approximately minus one percent, annualized.
I perform the same analysis with the National Association of College and University Business Officers (NACUBO) composite of large endowments.[18] It also, coincidentally, results in a 16-year annualized return of 6.88%. Its Market Index return is 9.27%. The annualized excess return for the endowments is -2.4%.[19]
Exhibit 3 shows the trend of cumulative Market Index-relative wealth for the two types of institutional investor since the GFC. The typical large endowment is worth 70% of what it would have been worth had it followed a comparable indexing strategy. That is the effect of underperforming by 2.4 percentage points per year for 16 years.
Exhibit 3
Cumulative Relative Wealth for Public Funds and Endowments
(Fiscal years 2009-2024)
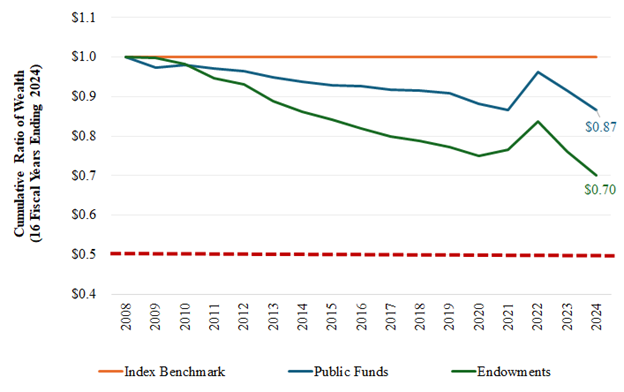
So, the endowments, with 65% in alts, perform 143 bps per year worse than public funds, with 35% in alts, after accounting for differences in market exposures and risk. This, however, is merely an indication of alts’ adverse impact on total portfolio performance — circumstantial evidence, as it were. The sections that follow link alts directly with the performance of institutional portfolios.
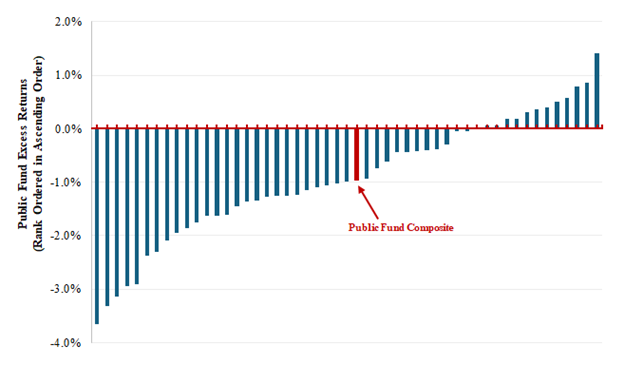
Cross-Sectional Analysis. I repeat the process described above for each of the 50 public pension funds to determine the annualized excess return of each.[20] Exhibit 4 shows the funds’ excess return in ascending order, ranging from -3.65% to +1.41% per year. It includes the equal-weighted composite of the funds, with an excess return of -0.96% per year.
Exhibit 4
Excess Return of 50 Public Pension Funds
(2009-2024)


As previously noted, we cannot observe how the returns of alternative investments affect excess return directly because we do not have asset-class-level returns. But we can observe whether increasing the funds’ exposure to alts augments market return with excess return (positive or negative), and to what extent it does so.
Exhibit 5 illustrates the result of regressing the funds’ excess returns shown in Exhibit 4 on their respective average (over time) alts allocation percentages. (Each of the 50 pension funds is represented by a blue plot point.) The relationship between the two is inverse, meaning the addition of alts generally augments market return with negative excess return; in other words, increasing the alts exposure reduces excess return. The slope coefficient is -0.071. This means that a 7.1 bps decline in excess return is associated with each percentage point increase in the allocation to alts. The slope coefficient is statistically significant, with a t-statistic of -4.9. The aggregate alts allocation percentage alone — a coarse slice of the total portfolio — nevertheless explains a healthy 33% (R2) of the variation in excess return.
The cross-sectional analysis provides direct evidence that alts have hurt risk-and-market-exposure-adjusted performance. Indeed, for a typical fund, e.g., the public fund composite, alts account for the entire margin of underperformance.
 Exhibit 5
Alternative Investments’ Impact on Excess Return
(FYs 2009-2024)
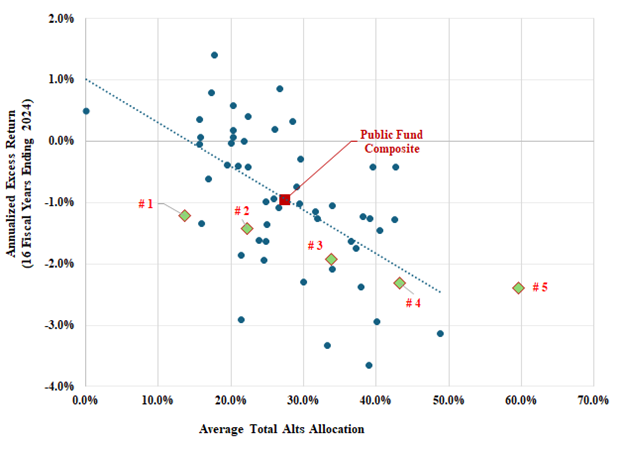
Endowments. The green diamonds in Exhibit 5 represent the experience of five cohorts of endowments, based on asset value, as reported by NACUBO. Cohort #1 includes funds with less than $50 million in assets. Cohort #5 comprises funds with assets greater than $1 billion. Each diamond represents 70 or more distinct portfolios, lending heft to the effective sample size of the endowments. The inverse relationship between exposure to alts and excess return holds for the endowments. Excess return declines monotonically as the alts exposure increases. Alts have been a significant drag on the performance of endowments, including the very large ones, which are known for their alts-investing.
The Effect of Specific Types of Alts. Exhibit 6 takes the analysis a step further. It shows the impact that the average allocation to alts subcategories has on excess return of the pension funds. The subcategories are: (1) private equity, (2) hedge funds, (3) commodities, (4) real estate and (5) miscellaneous, as reported by CRR. I perform the computations with multiple linear regression analysis. The regression R2 is now 47%, up from 33% when the alts subcategories were lumped together. In other words, segregating the influences of the different types of alts improves our understanding of their collective impact.
Column 1 of Exhibit 6 shows the funds’ average allocation to each subcategory of alts, and Column 2 shows the range of those allocations. Commodities, for example, were used sparingly, which turned out to have been a good thing during this period.
Column 3 shows the multiple regression betas of the individual alts subcategories. They represent the sensitivity of excess return to a one percentage point increase in the average allocation to the various alts subcategories. All but one of the sensitivities are negative, and three with statistical significance (having t-statistics greater than -2.0). This analysis identifies which alts had the biggest impact on excess return. Columns 3 and 4 indicate that hedge funds, commodities, and real estate had the most pronounced effect on excess return, with the greatest (negative) sensitivities and t-statistics.[21]
These results are consistent with ones reported by Andonov (2022) and Behmaram et al. (2024), which use a different dataset (that of CEM) and different methodologies. See also Aubry (2022), which uses CRR data.
Exhibit 6
Sensitivity of Excess Return to Exposure to Subcategories of Alts
(FYs 2009–2024)
|
Subcategory of Alternative Investment |
(1)
Average Allocation Over Time (%) |
(2)
Allocation Range (%) |
(3)
Sensitivity of Excess Return to a One-Percentage-Point Increase in the Allocation to the Subcategory/Category |
(4)
t- Statistic |
|
Private Equity |
8.5 |
0 to 23 |
0.0 |
0.0 |
|
Hedge Funds |
7.3 |
0 to 24 |
-6.9 |
-3.2 |
|
Commodities |
2.6 |
0 to 15 |
-14.9 |
-3.3 |
|
Real Estate |
7.0 |
0 to 16 |
-17.4 |
-4.5 |
|
Miscellaneous |
1.9 |
0 to 29 |
-5.1 |
-1.8 |
|
Total Portfolio |
27.4 |
0 to 49 |
-7.1 |
-4.9 |
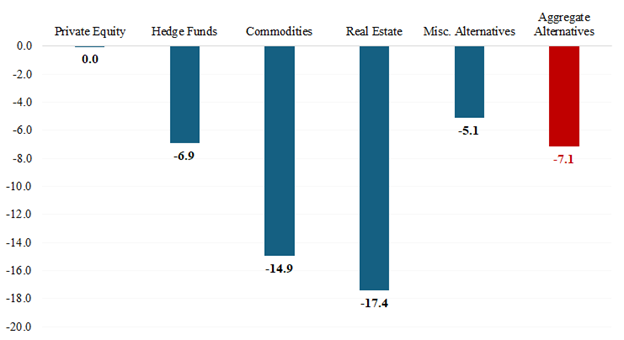
Exhibit 7 illustrates graphically the sensitivity of excess return to variation in exposure to the subcategories of alts shown in Column 3 of Exhibit 6, including sensitivity of excess return to aggregate alts, as discussed earlier. Some categories of alts have had a harsher impact on excess return than others. Of the Big Three — private equity, hedge funds and real estate — real estate and hedge funds have been the most counterproductive. Private equity neither helped nor hurt. These results jibe with the past performance of the various alts categories discussed earlier.
 Exhibit 7
Sensitivity of Excess Return to Alts Exposure
(FYs 2009-2024)
MAIN POINTS
Here is what we have covered so far:
- Private market assets cost 4% or more of asset value per year. Hedge funds take 3-4% per year in management fees and carry. As a result, institutional investors have overall expense ratios of 1% to 3% of asset value, depending on the extent of their alts allocation.[22] By comparison, traditional assets cost about 0.5% of asset value, and index funds are 5 bps, or less. Alts are very costly.
- Others’ research indicates that real estate and hedge funds have decidedly underperformed public market equivalents since the GFC. Private equity (buyout) returns have been moderately greater than those of public equity, ignoring differences in risk and liquidity.
- Large endowments, with 65% in alternative investments, have performed worse in risk-adjusted terms than public pension funds, which have 35% there. The excess return of the NACUBO large endowment composite is -2.4% per year since the GFC. Public pension funds’ excess return is -1.0% per year for the same period.
- Cross-sectional analysis shows that excess return at the total portfolio level of public pensions is very sensitive to alts exposure. A 7.1-basis-point reduction in excess return is associated with a one percentage point increase in the aggregate alts allocation. So, a reduction in excess return of 71 bps is associated with increasing the alts allocation by 10 percentage points. Alts account for the entire margin of underperformance of public pension funds, on average. Real estate and hedge funds have been the worst performers, consistent with the findings of other researchers.
- Endowments, including the largest ones, have experienced similarly poor performance linked to their alts-investing.
A LITTLE HISTORY
Auspicious Beginning
David Swensen launched the endowment style of portfolio management, with its heavy reliance on alts-investing, when he returned to Yale University in 1985. It caught on with other large endowments. Adherents experienced exceptionally good results for several years. From fiscal year 1994 to 2008, the NACUBO large endowment composite produced an excess (above market) return of 410 bps per year. This was the Golden Age of Alternative Investing.[23]
The GFC: A Watershed Event
The Golden Age ended abruptly with the GFC. In fiscal year 2009, Harvard, Yale, and Princeton, with their large alts allocations, were part of a natural experiment with a dramatic conclusion. They experienced an average return of -25.1%. This compares with -18.1% for a stock-bond index with matching market exposures and risk. Alts provided no downside protection when it was needed most. To the contrary: The bottom fell out of alts during the GFC. As shown in Exhibit 3, it has been downhill for alts-heavy institutions ever since.
Market Transformation
The very investor enthusiasm that helped propel alts’ returns pre-GFC began transforming the markets generating those returns.[24] Many trillions of dollars poured into alts, which were relatively small, isolated areas of investment in the early days. Aggregate alt assets under management increased more than tenfold between 2000 and 2020. Now, more than 10,000 alts managers vie for a piece of the action and compete with one another for the best deals and trades. A sizable valuation gap between public and private equity disappeared altogether between 1998 and 2006: The earnings yield (EBITDA / EV) of private equity in 1998 was ~12% while that of the S&P 500 was ~8%. The two converged at ~10% in 2006 and proceeded more or less in lockstep thereafter.[25] Market microstructure advanced, including formation of a burgeoning secondary market for private asset partnership interests.[26] Alts-investing investing is a good deal more competitive than it was way back when. Costs, though, remain high — far too high to support much value-added investing.
AGENTS CALL THE SHOTS
What accounts for the staying power of alts-investing? Andonov, Bauer, and Cremers (2017) maintain that public pension plans in the US emphasize alternative investments, and private equity, in particular, to maximize expected returns that go into actuarial calculations that determine the funded status of the plan and future levels of contribution. They assert that maximizing expected return in this way is part of a strategy to minimize the apparent cost of funding public pensions. Begenau, Liang and Siriwardane (2024), on the other hand, conclude that a better explanation is simply that CIOs and consultants believe alts-heavy portfolios will produce superior risk-adjusted returns. Ennis (2025b) claims that sheer vanity on the part of the overseers of elite university endowments has been one aspect of what he refers to as the “Endowment Syndrome.”
I choose to focus here on agency problems and weak governance in the management and supervision of these assets. The funds’ CIOs and consultant-advisors, who are responsible for formulating and implementing investment strategy, have an incentive to favor complex strategies.[27] They can earn much greater salaries and consulting fees advocating complex investments.[28] Doing this also helps burnish their reputation as shrewd investors. And they get to do it with large amounts of other people’s money. This is the heart of the agency problem of institutional investing. CIOs and consultant-advisors are also responsible for performance reporting. A critical part of performance evaluation is the benchmark used to gauge performance. Benchmarks used by institutional investors in the US understate a fair return expectation for the funds by an average of 1.5% per year.[29] The benchmarks are slow rabbits, in other words. Trustees often pay their CIO and investment staff bonuses tied to performance relative to those very benchmarks. This is a stark governance failure, and it reinforces the incentive to maintain complex, expensive investment programs rather than simple ones. As Charlie Munger was fond of saying, “Show me the incentive and I’ll show you the outcome.”
HOW WILL THINGS PLAY OUT?
Trustees are ultimately responsible for fund management. I believe institutional investment trustees will eventually wise up, just as mutual fund investors did with active management. Thirty years ago, mutual fund investors had practically no index funds. They now index half their equities, and the proportion has been growing steadily.[30] Investors in equity mutual funds brought their expense ratios down by 58% between 2000 and 2023, from a weighted average of 1.01% to 0.42%.[31] Stock and bond index funds are available to the smallest investor for 5 bps or less. (I acknowledge that most mutual fund investors act as principals, not agents, which makes it easier to see things clearly.)
Institutional investors will not renounce the endowment model overnight. Rather, it will fade away over a couple of decades. Public pension plans, owing to their public nature and political exposure, may act sooner than endowments. For some asset owners, the catalyst may be high cost; for others, it may be poor performance. Many will realize that alts’ diversification benefits are illusory.[32] CIOs may give up on a particular asset class before they abandon others. In any event, I do not see a wholesale upending of the status quo. That’s not how these things play out. That said, trustees do pay attention to which way the wind is blowing. If they detect a shift in sentiment among peers, that could accelerate the process. (Never underestimate the power of herding among institutional investors.[33])
Trustees don’t stand to gain from the status quo in the same way as CIOs and consultant-advisors. With trustees, it’s more a matter of being asleep at the switch. Any number of things could rouse them. Here are some possibilities:
- Failing to meet stated investment goals. Since the GFC, public pensions have failed to meet their actuarial return requirement, which many say is their paramount goal. Endowments have not kept pace with typical stated inflation-based return objectives. Research shows that low-cost index investing would have improved the likelihood of their meeting these goals.[34]
- Realizing that their portfolio is worth half of what it would have been worth had they followed a simple indexing strategy. With underperformance of 2.4 percentage points per year since the GFC, large endowments are worth 70% of what they would have been worth had they followed an indexing strategy. If they continue to underperform at the same pace for another 15 years, I estimate their value will be half that associated with a comparable indexing strategy. (See Exhibit 3.) At some point the performance problem becomes too big to ignore.
- Illiquidity: Universities, with tens of billions in endowment, borrowing at unprecedented levels to support operations. Public pension plans (e.g., CalSTRS) borrowing against their portfolio to raise funds for the “flexibility” to rebalance their asset allocation. (It’s not leverage; it’s flexibility.) [35] The heavy reliance on private assets is compromising institutions’ normal operation while increasing risk.
- Trustees recognizing the agency issues at work and acting to redress them. Diligent trustees will stop paying CIOs bonuses for beating benchmarks created by the CIOs and/or consultant-advisors. They will find other ways to compensate truly excellent performance. Switching to index-based benchmarks would have a benign effect on practice.
- Media reports of undergrad investment clubs with track records better than those of elite university investment offices.
- The advent of an accounting requirement that public pension plans report their investment expenses — including carry — fully and in detail. With that information, it would be easy to figure out what educational endowments are paying. This would come as news to most trustees, public and private, and make them uneasy.
- With the advent of normal interest rates after years of the Fed’s zero-interest-rate policy, substantial leverage of buyout investments coming into play in a way we have not seen since the GFC. News of a thousand bankruptcies among zombie corporations, many of them in buyout funds, would not be lost on trustees.[36]
- Enlightened trustees leaving their successors notes that say, Put an end to this. I wish I had.
- College and university boards discovering that, like Harvard, they are spending more on money managers — for no benefit — than they collect in tuition.[37]
- Trustees discovering that secondary market pricing of private assets can be much lower than reported NAVs. Real estate and venture capital interests, for example, have been transacting at discounts of 25% or more of NAV in recent years.
- Being sued for breach of fiduciary duty. Trustees serve on behalf of others. Their duty is to be prudent and loyal to the beneficiary; there is no requirement to be clever or attempt to maximize gain. Wasting assets is verboten. We live in a litigious world.
- Taxpayer revolts. US taxpayers have about had it with public worker pensions as it is. Heightened awareness of investment waste might accelerate the transition to defined contribution plans for new public employees.
SUMMARY
Alts cost too much to endure as a permanent part of institutional investment portfolios. I estimate the cost of a diverse portfolio of alts is at least 3% to 4% of asset value, annually. As a result, institutional investors have overall expense ratios of 1% to 3% of asset value, depending on the extent of their alts allocation. Alts bring extraordinary costs but ordinary returns — namely, those of the underlying equity and fixed income assets. Alts have had a significantly adverse impact on the performance of institutional investors since the GFC. Owing to the extraordinary cost of alts-investing, there is no reason to believe this will change.
Agency problems and weak governance have sustained alts-investing. CIOs and consultant-advisors, who develop and implement investment strategy, have an incentive to favor complex investment programs. They also design the benchmarks used to evaluate performance. Benchmark returns are downwardly biased. Compounding the incentive problem, trustees often pay bonuses based on performance relative to these benchmarks. This is an obvious governance failure. The spirit of stewardship is taking a beating in all this.
Observing alts-laden portfolios — conspicuously leaking value as they go — brings to mind Stein’s Law: “If something cannot go on forever, it will stop.”
Alts-heavy investing will not end all of a sudden. It will peter out. Institutional investors will gravitate to low-cost portfolios of stocks and bonds over 10 to 20 years. The world of long-term, fiduciary investing will become much less interesting, as it should be. Like individual investors handling their own funds, trustees will wise up — eventually.
ACKNOWLEDGMENTS
I appreciate the contributions of Brian Bruce, Antti Ilmanen, Eric Johnson, Jeffrey McCurdy, Joseph Pagliari, Jr., Ludovic Phalippou, William Sharpe, and Michael Weisbach.
REFERENCES
Andonov, A. 2022. “Delegated Investment Management in Alternative Assets.” The Review of Corporate Finance Studies, 00, 1–38.
Andonov, A., R. Bauer, and M. Cremers. 2017. “Pension Fund Asset Allocation and Liability Discount Rates.” The Review of Financial Studies, Volume 30, Issue 8, Pages 2555–2595.
Aubry, J.-P. (2022). “Public Pension Investment Update: Have Alternatives Helped or Hurt?” Center for Retirement Research at Boston College, Issue in Brief 22-20.
Augustin, N., M. Binfarè, and F. Elyas. 2023. “Benchmarking Private Equity Portfolios: Evidence from Pension Funds.” Available at SSRN: https://ssrn.com/abstract=4590271.
Bain & Company. 2025. Global Private Equity Report. https://www.bain.com/globalassets/noindex/2025/bain-report_global-private-equity-report-2025.pdf
Barth, D., J. Joenvaara, M. Kauppila and R.R. Wermers. (2023). “A Bias-Free Assessment of the Hedge Fund Industry: A New Evaluation of Total Assets, Alphas, and the Flow-Performance Relation.” OFR WP 20-01. Available at SSRN: https://ssrn.com/abstract=3544181.
Behmaram, P., Flynn, C. and van Brag, M. 2024. “Asset Allocation and Fund Performance of Defined Benefit Pension Funds in the United States, 1998-2022.” CEM Benchmarking. https://www.reit.com/sites/default/files/2024-11/CEM_Nov2024_Report.pdf.
Begenau, J., P. Lang and E. Siriwardane. 2024. "The Rise of Alternatives." Harvard Business School Working Paper, No. 25-016.
Ben-David, I., J. Birru, and A. Rossi. 2023. “The Performance of Hedge Fund Performance Fee.” Fisher College of Business Working Paper No. 2020-03-014. Available at SSRN: https://ssrn.com/abstract=3630723.
Bollen, N.P.B., J. Joenvaara and M. Kauppila. 2021. “Hedge Fund Performance: End of an Era?” Financial Analysts Journal, 77:3, 109-132.
Bollinger, M. A., & Pagliari, J. L. (2019). “Another Look at Private Real Estate Returns by Strategy.” Journal of Portfolio Management, 45(7), 95–112.
Boyer, B. H., T.D. Nadauld, K. Vorkink, and M. Weisbach. 2023. “Discountâ€Rate Risk in Private Equity: Evidence from Secondary Market Transactions,” The Journal of Finance 78, 835–885.
Cambridge Associates. 2020. “Private Investments.”
CEM Benchmarking. 2024. “Asset Allocation and Fund Performance of Defined Benefit
Pension Funds in the United States, 1998-2022.”
Center for Retirement Research, Boston College. See https://publicplansdata.org/quick-facts/national/.
Clearwater Analytics. 2024. “2024 State of Alternatives.” https://www.prnewswire.com/news-releases/clearwater-analytics-study-reveals-55-of-institutional-investors-set-to-boost-their-alternative-investments-302158698.html
Cliffwater. 2024. “2024 Study on Private Fund Fees and Expenses for Direct Lending.” https://www.cliffwater.com/ResourceArticle/2024-study-on-private-fund-fees-and-expenses-for-direct-lending?docId=22527.
Ennis, R.M. 2021. “Endowment Performance.” The Journal of Investing, 30 (3) 6-20.
———. 2022a. “A Universal Investment Portfolio for Public Pension Funds: Making the Most of Our Herding Ways.” The Journal of Investing 32: (1) 7-20.
———. 2022b. “The Fairy Tale of Alternative Investing.” The Journal of Investing 30th Anniversary Special Issue, 31 (4) 11-16.
———. 2023. “Lies, Damn Lies, and Benchmarks: An Injunction for Trustees.” The Journal of Investing 32 (4) 6-16.
———. 2024a. “Second Guessing CalSTRS on Investment Strategy: A Case Study.” The Journal of Investing, 34 (2) 7-13.
———. 2024b. “Are Institutional Investors Meeting Their Goals? Spotlight on Earnings Objectives.” Enterprising Investor, CFA Institute.
———. 2025a. “How Hidden Costs Undermine Public Pensions in the United States.” The Journal of Investing. DOI: 10.3905/joi.2025.1.342.
———. 2025b. “The Endowment Syndrome.” Enterprising Investor, CFA Institute.
——— . 2025c. “Big Funds, Small Gains: Rethinking the Endowment Playbook.” Enterprising Investor, CFA Institute.
Harris, R.S., T. Jenkinson and S.N. Kaplan. 2016. “How Do Private Equity Investments Perform Compared to Public Equity. https://papers.ssrn.com/sol3/papers.cfm?abstract_id=2597259?
Harris, R.S., T. Jenkinson, S.N. Kaplan, and R. Stucke. 2022. “Has Persistence Persisted in Private Equity? Evidence from Buyout and Venture Capital Funds.” Fama-Miller Working Paper, Available at SSRN: https://ssrn.com/abstract=2304808.
Higgins, M.J. 2024. “The Unspoken Conflict of Interest at the Heart of Investment Consulting.” Enterprising Investor, CFA Institute.
Ilmanen, A., S. Chandra, and N. McQuinn. 2020. “Demystifying Illiquid Assets: Expected Returns for Private Equity.” The Journal of Alternative Investments 22 (3): 8–22.
Investment Company Institute. March 21, 2024. “Mutual Fund Expense Ratios Have Declined Substantially over the Past 27 Years.”
Jeffries. 2025. “Secondary Market Review.” See https://storage.pardot.com/399542/1737986083KArID4CI/Jefferies___Global_Secondary_Market_Review___January_2025.pdf.
Jenkinson, T., H. Kim, and M. Weisbach. 2021. “Buyouts: A Primer.” NBER Working Paper No. w29502, Available at SSRN: https://ssrn.com/abstract=3968725.
Kaplan, S.N. 2023. “Private Equity: Past, Present and Future.” Testimony before SEC Investor Advisory Committee.
Lee, S.K. and T.J. Mete. 2024. “Harvard Plans $1.65 Debt Financing Amid Donor Turmoil.” The Harvard Crimson.
L’Her, Jean-Francois, Rossita Stoyanova, Kathryn Shaw, William Scott and Charissa Lai. 2016. “A Bottom-Up Approach to the Risk-Adjusted Performance of the Buyout Fund Market.” Financial Analysts Journal, Volume 72, Issue 4 (July/August), pp. 36-48.
Lim, W. 2024. “Accessing Private Markets: What Does It Cost?” Financial Analysts Journal, 80(4), 27–52.
Lu, Y., K. Mullally and R. Sugata. 2022. “Paying for Performance in Public Pension Plans.”
Forthcoming, Management Science. https://papers.ssrn.com/sol3/papers.cfm?abstract_id=3781915.
NACUBO-Commonfund Study of Endowments. 2024. https://www.nacubo.org/Research/2024/NACUBO-Commonfund-Study-of-Endowments.
Nadauld, T., B. Sensory, K. Vorkink and M. Weisbach. 2019. “The Liquidity Cost of Private Equity Investments: Evidence from Secondary Market Transactions.” Journal of Financial Economics, Volume 132, Issue 3, June 2019, Pages 158-18.
Phalippou, L., and O. Gottschalg. 2009. “The Performance of Private Equity Funds.” The Review of Financial Studies 22 (4): 1747–1776.
Phalippou, L. 2023. Private Equity Laid Bare, Version 3. Independently published: www.pelaidbare.com.
ProPublica. 2009. “Yale's Financial Wizard, David Swensen, Says Most Endowments Shouldn't Try to Be Like Yale.” https://www.propublica.org/article/yales-financial-wizard-david-swensen-says-most-endowments-shouldnt-try-to-b.
Rekenthaler, J. 2024. “Index Funds Have Officially Won.” Morningstar.
Riddiough, T. 2022. “Pension Funds and Private Equity Real Estate: History, Performance, Pathologies, Risks,” Handbook of Real Estate and Macroeconomics, Edgar.
Sharpe, W. F. 1988. “Determining a Fund’s Effective Asset Mix.” Investment Management Review (September/October): 16–29.
——— . 1992. “Asset Allocation: Management Style and Performance Measurement.” Journal of Portfolio Management Winter: 7-19.
Sullivan, R.N. 2021. “Hedge Fund Alpha: Cycle or Sunset?” The Journal of Alternative Investments, Winter 23(3): 55-79.
[1] Center for Retirement Research at Boston College as of June 30, 2024.
[2] NACUBO 2024 Endowment Study as of June 30, 2024.
[3] Clearwater Analytics (2024).
[4] Dr. Swensen passed away in 2021.
[5] See ProPublica (2009).
[6] The equation is y = 0.0337x + 0.0021, where y is total cost, and x is the allocation to alts over the study period. The slope coefficient of 0.337 is statistically significant with a t-statistic of 3.6.
[7] See CEM (2024).
[8] See CEM (2024).
[9] A working paper by Barth et al. (2023) indicates that a newly emergent subset of hedge funds—ones not included in vendor databases—has produced better returns than those that do participate in the databases. The reason for this is unclear, and the paper is a work in progress. Nevertheless, the revelation of the existence of these heretofore apparently overlooked funds suggests that they warrant further study.
[10] Multiple of money is the ratio of total amount distributed plus net asset value divided by the total amount paid in. It is also called total value to paid in (TVPI).
[11] Phalippou (2023) argues that buyout PME is more like 1.0 with better benchmarking (market index selection). See also L’Her et al. (2016), which incorporates adjustments for size, leverage and sector in the stock index benchmark. This has the effect of reducing PME to an average of about 1.0 between 1998 and 2014.
[12] From correspondence with the author. For an extended discussion, see Ilmanen et al. (2020).
[13] I define “excess return” as the difference between portfolio return and that of an appropriate benchmark, one with the same market exposures and risk. I reserve use of the term “alpha” for the intercept of a regression of portfolio returns on those of a market benchmark.
[14] The funds’ staffs, consultants, custodians, actuaries, and accountants routinely process public pension funds’ total portfolio returns in connection with their work for the funds.
[15] Refer to https://publicplansdata.org/quick-facts/.
[16] The Market Index is derived using the constrained multiple regression method of Sharpe (1988, 1992).
[17] The Market Index combines the Russell 3000 stock index (52%), MSCI ACWI ex-US stocks (19%), and Bloomberg US Aggregate bond index (29%). The R2 of the public fund composite with the Market Index is 99.3% for the 13 years ended June 30, 2021, with tracking error of 1.0%. I omit returns for fiscal years 2022–2024, which reflect extraordinary return smoothing, which in turn frustrates efforts to use historical data in characterizing the Market Index. The US stock market declined sharply in the fourth quarter of fiscal year 2022. The net asset values (NAVs) used in valuing institutional fund returns at year-end 2022 did not reflect the decline in equity values owing to the practice of using NAVs lagged by one or more quarters in portfolio valuations. The equity market rose sharply the following year, and once again marks for private assets lagged as NAVs began to reflect the prior downturn. The overall effect was to sharply attenuate losses in reporting for 2022 and tamp down gains in 2023 and 2024. It will take at least through 2024, and possibly 2025, before these effects work their way through the valuation process. (For a further discussion of this issue, see Ennis (2025c). I rely on the first 13 years of the return series to characterize the benchmark statistically based on the fact that the asset allocation of the composite changes but glacially, and the composition of stock and bond components are index-like. Under these conditions, a sample size of 13 is ample, as indicated by the regression statistics.
[18] NACUBO’s large fund composite includes endowment with assets greater than $5 billion beginning in fiscal year 2023. Prior to that it comprised endowments with greater than $1 billion in assets.
[19] The Market Index for the NACUBO series is Russell 3000 stock index (67%), MSCI ACWI ex-US stocks (16%), and Bloomberg US Aggregate bond index (17%). The R2 of the public fund composite with the Market Index is 97.6% for the 13 years ended June 30, 2021, with tracking error of 2.2%.
[20] There is no publicly available source for individual endowment returns.
[21] Commodities, which are not capital assets, are not a principal focus of this study. I include them only because they appear in CRR’s reporting of asset allocation and are part of the total alts figure reported there. Commodities are different enough from equity and fixed income investments such that they really do not fit in the analytical framework used here, in my judgment. Thus, my reporting on commodities is incidental.
[22] I estimate Harvard University, for example, with nearly 80% of its endowment in alts, incurs investment expenses of approximately 3% of asset value, annually. This includes management fees, carry, and the cost of operating Harvard Management Co.
[23] See Ennis (2021).
[24] I observe positive auto correlation of returns for public funds and endowments between 2000 and 2008. Autocorrelation turns negative after the GFC. Return momentum that was evident pre-GFC disappeared post-GFC.
[25] See Ilmanen et al. (2020).
[26] See Nadauld et al. (2019). Also, see See Jeffries (2025), which reports that secondary market volume, $40 billion in 2015, grew to $162 billion in 2024.
[27] See Higgins (2024).
[28] See Lu, Mullally and Sugata (2022).
[29] See Ennis (2023). See also Augustin, Binfarè and Elyas (2023).
[30] See Rekenthaler (2024).
[31] See Investment Company Institute (2024).
[32] See Ennis (2022b).
[33] See Ennis (2022a).
[34] See Ennis (2024b).
[35] See Ennis (2024a).
[36] Buyout firms are sitting on a record 29,000 companies worth $3.6 trillion, half of which they have owned for five years or more, according to Bain & Company (2025).
[37] Harvard University reported tuition income of $1.4 billion for fiscal year 2024. The value of the endowment at year-end was $53.2 billion. As mentioned in footnote 22, I estimate Harvard’s total cost of endowment management at 3% of asset value. Three percent of $50 billion is $1.5 billion

