Buyout Performance with Assets Valued at Market
Institutional investors in the U.S. have invested heavily in leveraged buyouts over the last quarter of a century. And yet, debate persists over whether these costly investments[1] are actually beneficial. Do buyout funds have betas less than or equal to 1 with a positive alpha? Or is beta closer to 1.5–2.0, with little or no alpha once risk is properly measured?
Conventional wisdom holds that adding private equity to a portfolio of stocks and bonds produces greater return while dampening portfolio volatility. Some prominent academics support this view. Korteweg and Nagel (2024) estimate buyout fund betas using cash flows and find them to be less than or equal to 1.0. Brown, Gonçalves, and Hu (2024), using cash flows and net asset values (NAVs), estimate that leveraged buyout volatility is less than that of publicly traded stocks, with a beta of 0.89, and significant alpha of 2.5% per year. Critics (see, for example, Asness, 2023) believe the volatility of buyout investments, based on NAVs provided by the funds’ sponsors, is significantly understated and that risk-adjusted return is overstated. According to Ilmanen, Chandra, and McQuinn (2020), “Due to the absence of mark-to-market accounting, the reported volatility and equity beta of private assets tend to be understated, unless one de-smooths their returns, which may not be a clear-cut exercise.” They show that, all else the same, underestimating beta results in overstating alpha.
What is largely absent from this debate are market values for buyout funds, and thus actual time‑weighted, market‑based rates of return. Scholars infer statistics such as beta and alpha from cash flow and NAV histories, but the methods are intricate and often inaccessible to practitioners. We instead shed light on buyout performance using public‑market prices for portfolios of private equity fund interests, which provide both market‑based returns and sponsor‑reported NAVs for the same assets. To do this, we use an index of buyout shares traded on various European stock exchanges. We refer to these shares collectively as listed private equity (LPE).[2]
LISTED PRIVATE EQUITY
The Private Equity Universe
The field of private equity is vast and diverse. There are 18,000 funds with more than $5 trillion in assets.[3] The great majority of assets are held in unlisted limited partnerships. There are many fewer listed funds. Some LPE tallies include venture capital and private debt, as well as public corporations active in various aspects of private market investment. Bilo et al. (2005) identify 287 such LPE firms. The S&P Listed Private Equity Index includes approximately 85 companies, primarily in Europe and North America, with an aggregate value of approximately $800 billion.[4] Private equity investment management and operating companies — private equity and credit businesses, as it were — such as Apollo, Blackstone, Brookfield, and KKR, make up the lion’s share of the value of the S&P LPE index.
We focus on a narrower slice of LPE: closed‑end portfolios of private equity fund interests listed on European stock exchanges. These are “pure” buyout vehicles, with both NAVs and market prices available daily for the same underlying funds. These fund interests are typical of the private equity investments made by institutional investors, such as pension funds and endowments.
A Market Benchmark
We use a novel index of private equity returns, the Finominal Private Equity Index (FPEI), to evaluate the performance of private equity as an asset class. The Index is based on a universe of 29 funds listed on various European stock exchanges, with return histories dating back to the 1980s. These are closed‑end funds comprising portfolios of buyout partnerships of the type held by pension funds and endowments; many of the underlying sub‑funds are in fact used by large institutional LPs. Several of them are funds of funds that invest in many individual private equity funds. Collectively, the funds are diversified by manager, geography, sector, vintage, and size. The FPEI funds hold more than 2,000 individual portfolio companies. The index is market-cap weighted, and returns are stated in US dollar terms. Index construction captures the impact of non-surviving funds. Daily data are available for index capitalization, NAV and market-based returns. The aggregate market capitalization is $19.4 billion.[5] See Exhibit 1.
Exhibit 1
Universe of Listed Private Equity Funds
|
Name |
Stock Ticker |
Actively Trading |
Listing Date |
Market |
Market Cap ($m) |
Market Cap (% of Total) |
|
HgCapital Trust plc |
HGT |
Yes |
Dec-1989 |
London |
3,106 |
16% |
|
HarbourVest Global Private Equity Ltd. |
HVPEa |
Yes |
May-2010 |
London |
2,587 |
13% |
|
Caledonia Inv. |
CLDN |
Yes |
Jan-1986 |
London |
2,494 |
13% |
|
Pantheon International plc |
PANI |
Yes |
Nov-1987 |
London |
1,907 |
10% |
|
Oakley Capital Investments Ltd. |
OCIO |
Yes |
Aug-2007 |
London |
1,256 |
6% |
|
ICG Enterprise Trust plc |
ICGT |
Yes |
Jul-1981 |
London |
1,219 |
6% |
|
Altamir |
LTA |
Yes |
Mar-2006 |
Paris |
1,210 |
6% |
|
Patria Private Equity Trust plc |
PPET |
Yes |
May-2001 |
London |
1,038 |
5% |
|
Apax Global Alpha Limited |
APAX |
Yes |
Jun-2015 |
London |
1,050 |
5% |
|
NB Private Equity Partners Ltd. |
NBPE |
Yes |
Jul-2007 |
London |
872 |
4% |
|
Chrysalis Inv. |
CHRY |
Yes |
Nov-2018 |
London |
828 |
4% |
|
Partners Group Private Equity Ltd. |
PEY |
Yes |
Dec-2006 |
London |
788 |
4% |
|
CT Private Equity Trust plc |
CTPE |
Yes |
Mar-1999 |
London |
471 |
2% |
|
Private Equity Hldg. |
PEHN |
Yes |
Jan-1999 |
Zurich |
213 |
1% |
|
JZ Capital Ptnrs. |
JZCP |
Yes |
Sep-2015 |
London |
159 |
1% |
|
EPE Special Opps. |
ESO |
Yes |
Sep-2003 |
London |
110 |
1% |
|
Castle Private Eq. |
CPEN |
Yes |
Dec-2008 |
Zurich |
42 |
0% |
|
Dunedin Ent. Inv. |
DNE |
Yes |
Apr-1987 |
London |
35 |
0% |
|
JPEL Private Equity Ltd. |
JPEL |
Yes |
Jun-2005 |
London |
22 |
0% |
|
LMS Capital plc |
LMS |
Yes |
Jun-2006 |
London |
20 |
0% |
|
KKR Private Equity Investors, L.P. |
KPE |
Delisted |
May-2006 |
Amsterdam |
|
|
|
SVG Capital plc |
SVI |
Delisted |
May-1996 |
London |
|
|
|
Conversus Capital L.P. |
CCAP |
Delisted |
Jun-2007 |
Amsterdam |
|
|
|
AP Alternative Assets L.P. |
AAA |
Delisted |
Aug-2006 |
Amsterdam |
|
|
|
Absolute Private Equity AG |
ABSP |
Delisted |
May-2001 |
Zurich |
|
|
|
Better Capital PCC Ltd. |
BCAP |
Delisted |
Dec-2009 |
London |
|
|
|
Electra Private Equity plc |
ELTA |
Delisted |
Feb-1976 |
London |
|
|
|
shape Capital AG |
SHPN |
Delisted |
Nov-2001 |
Zurich |
|
|
|
Candover Investments PLC |
CDI |
Delisted |
Dec-1984 |
London |
|
|
|
Total |
|
|
|
|
19,426 |
100% |
Source: Finominal
While FPEI is a plausible benchmark for private equity investments, it has limitations. It is relatively new with scant documentation currently. And while diversified along conventional lines, it lacks depth and breadth relative to the $5 trillion market. It captures the returns of primarily small- and micro-cap stocks, where data quality is comparatively poor, with missing prices and pricing gaps. For now, FPEI is the only publicly available source of market‑based returns for diversified portfolios of buyout funds. In what follows, we describe steps taken to mitigate missing prices and thin trading.
Total Return of Listed Private Equity vs. Public Stocks
Here we compare the annual rate of return of FPEI with that of the MSCI World Index over various periods. The logic for using the MSCI World Index is as follows: First, over the last 25 years, the geographic breakdown of buyout investments has been roughly 60% US, 40% non-US. In recent years, the majority of LPE assets have been invested outside the US. [6] These facts do not justify excluding non-US stocks in favor of a US-only index, like Russell 3000. So, we select a global index. Second, there has been comparatively little buyout activity in emerging markets. For this reason, we favor MSCI World over ACWI, which currently includes a 10% allocation to emerging markets.
Exhibit 2 shows that private equity investments, as proxied by FPEI, have had returns similar to those of global stocks. The annualized differences between the two series have been fairly small: -2.3% to 0.3% over various time periods. The volatilities of the two series, however, differ greatly.
Exhibit 2
Annual Rates of Return of FPEI and Public Equity
|
Years Ended June 30, 2025 |
Finominal Private Equity Index |
MSCI World Index |
Difference |
|
5 |
13.9% |
14.6 |
-0.7% |
|
10 |
8.4 |
10.7 |
-2.3 |
|
15 |
11.8 |
11.5 |
0.3 |
|
20 |
6.8 |
8.5 |
-1.7 |
Volatility
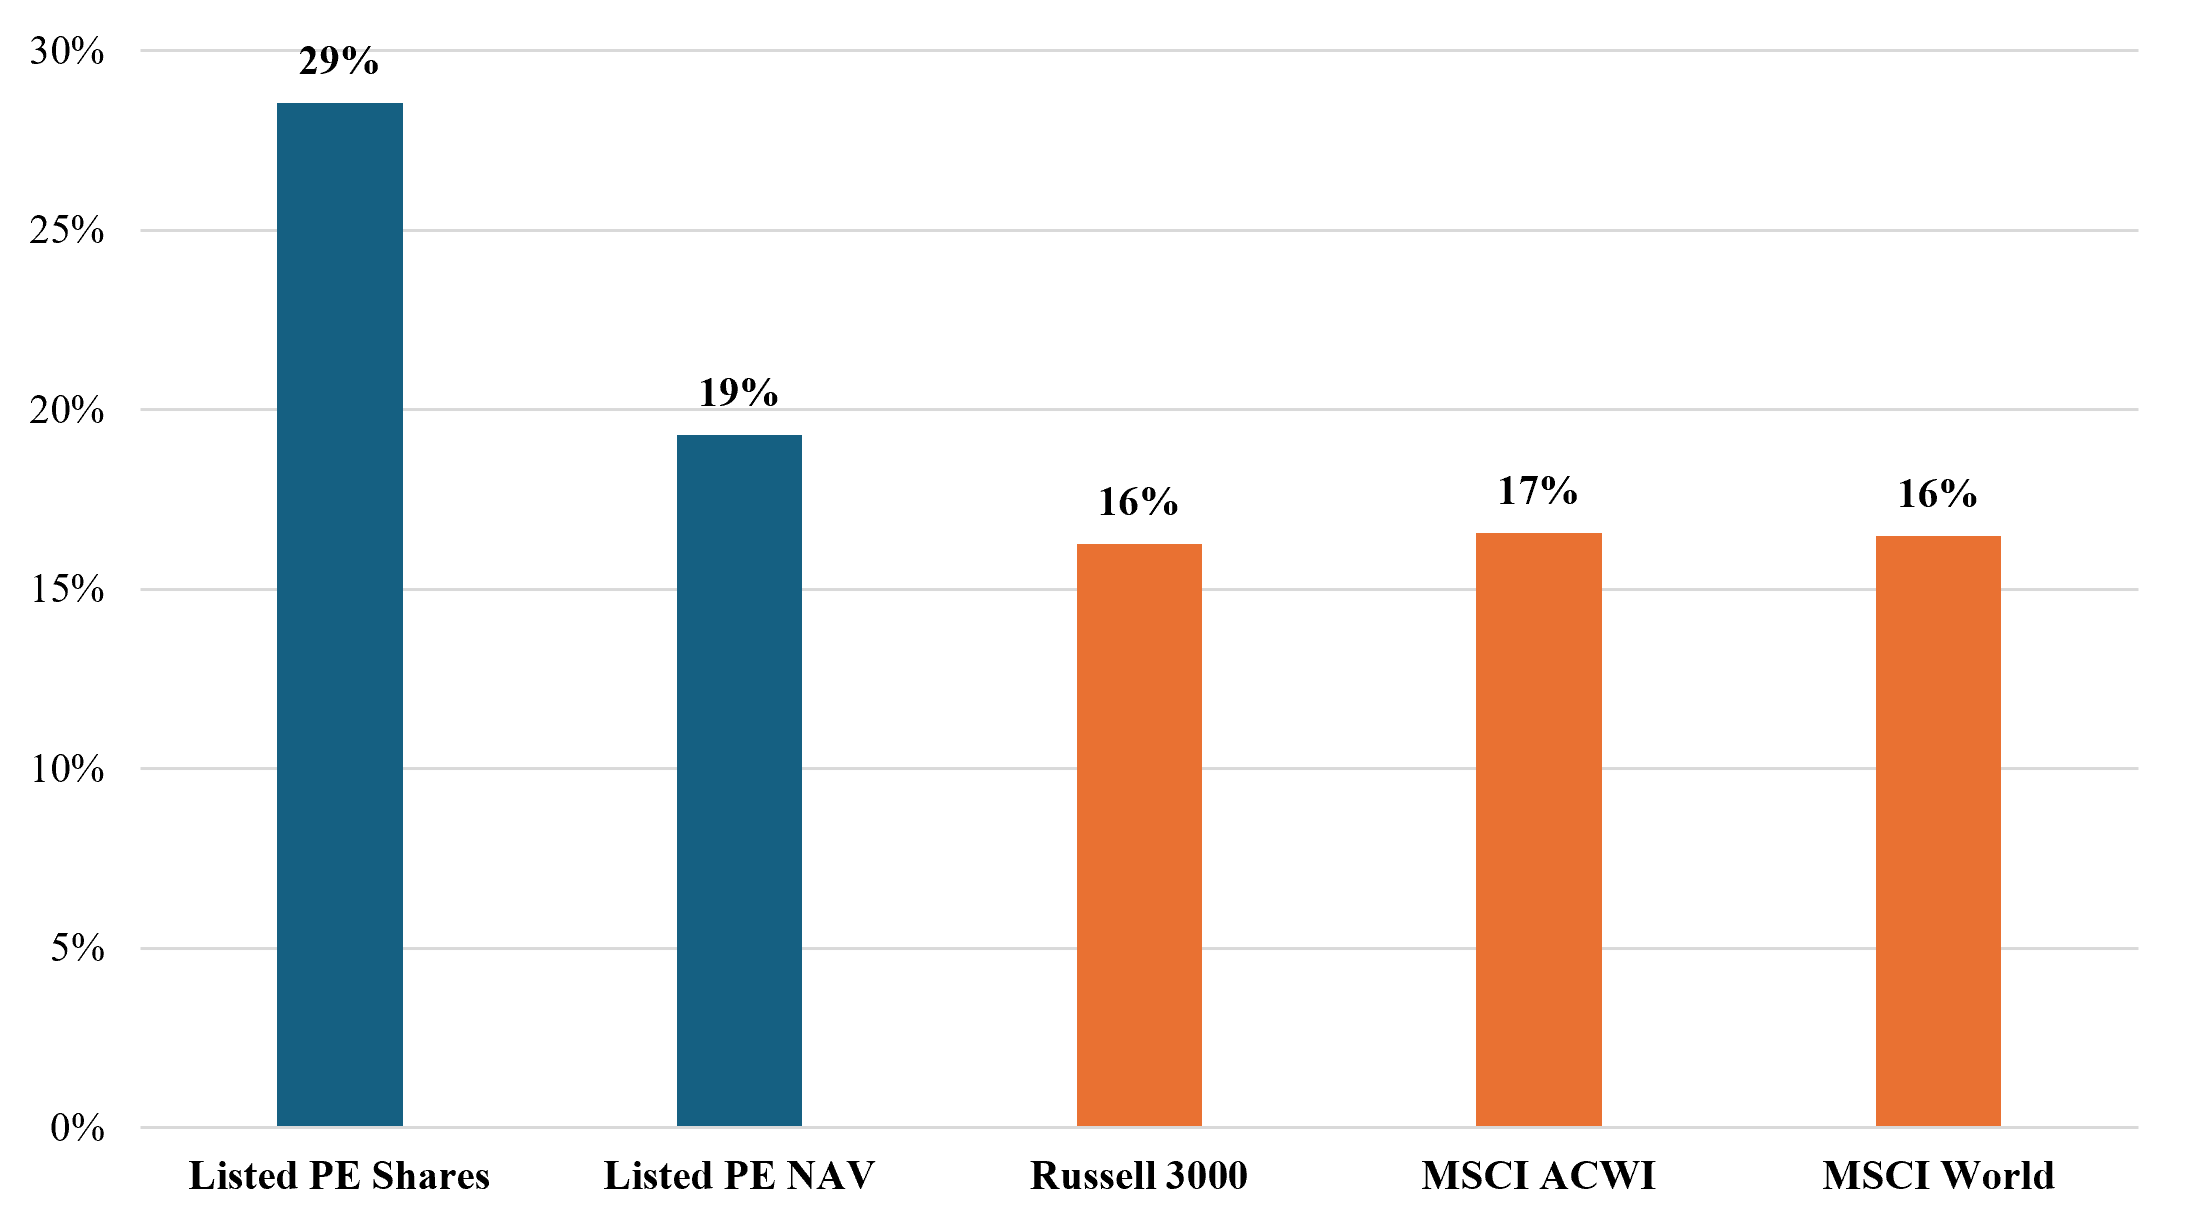
Exhibit 3 shows that LPE NAV volatility is only modestly higher than that of global stocks (19% vs. 16%), whereas the volatility of the same funds at market prices is much higher (29% vs. 16%).
Exhibit 3
Annualized Volatility Comparison
(June 30, 2005–2025)
Following Rasmussen and Grinstead (2025)
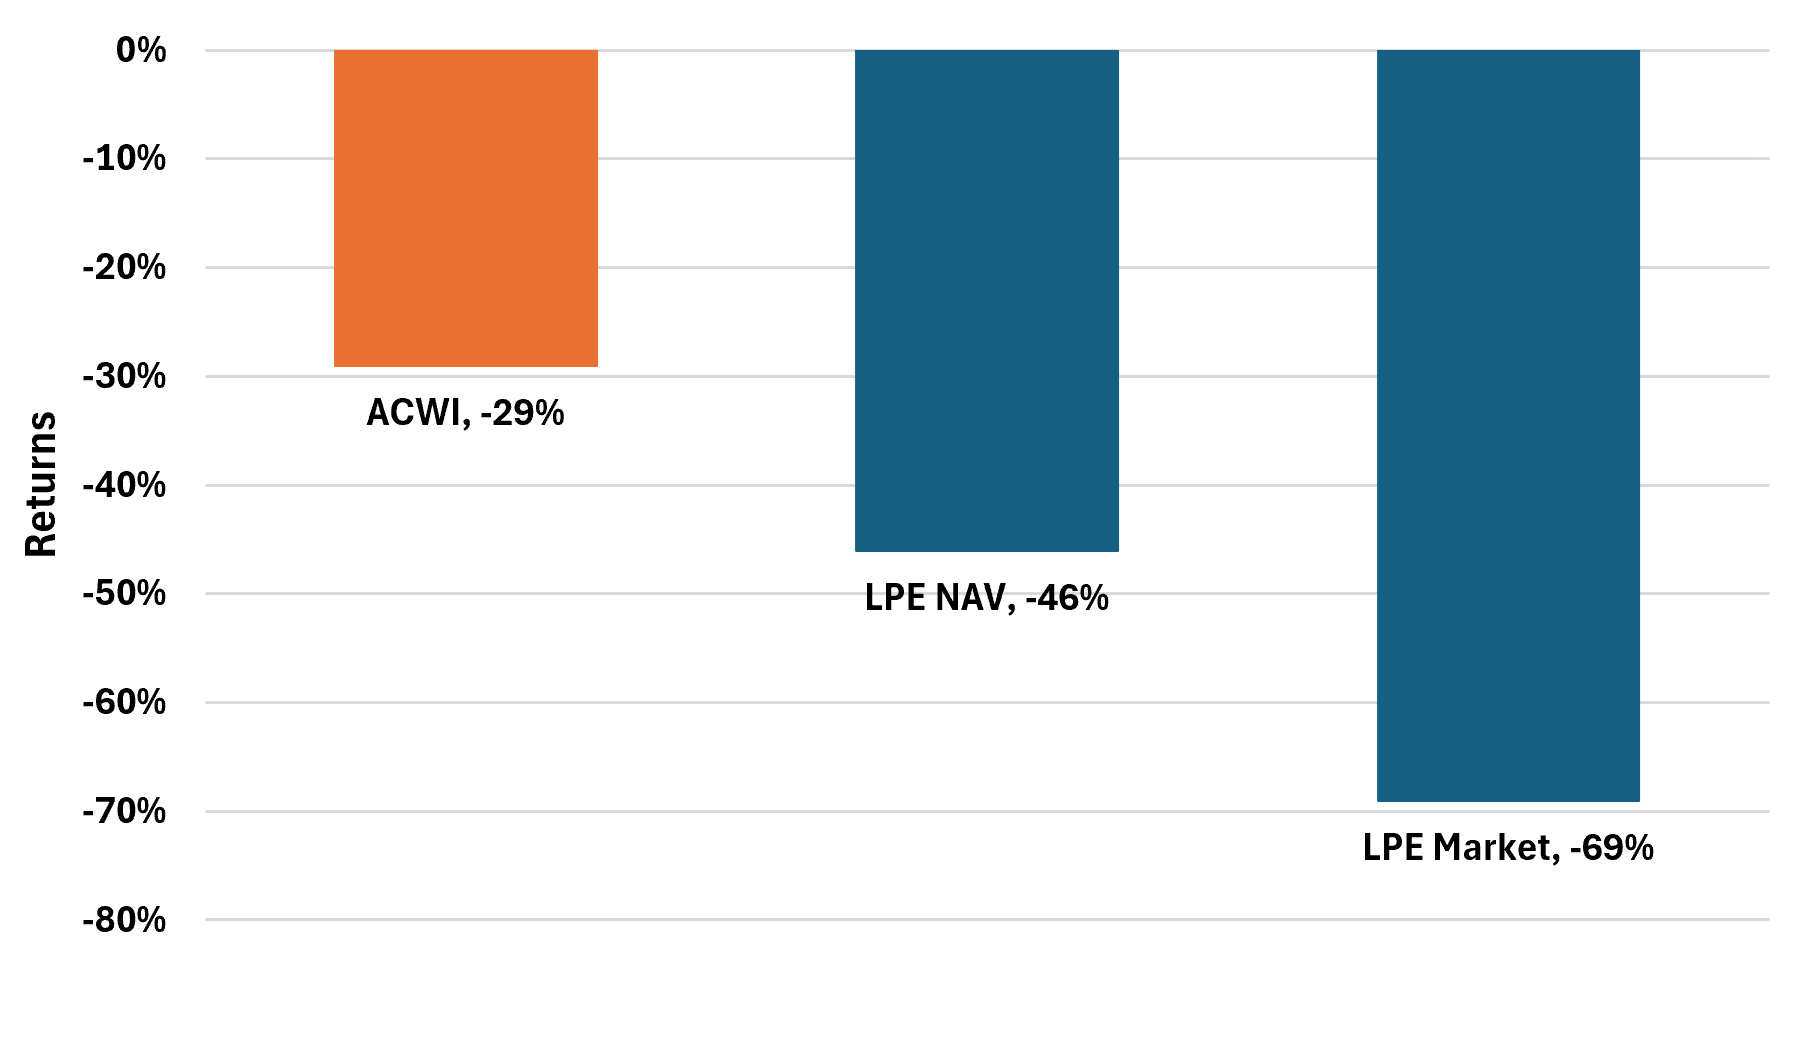
While volatility is a primary risk measure, many investors find drawdowns more tangible. The drawdowns in NAVs are much smaller than those in market prices. For example, Exhibit 4 shows that over the year ending June 30, 2009, the LPE index suffered a drawdown 2.4 times that of MSCI ACWI, consistent with the much higher volatility of market‑priced LPE.
Exhibit 4
Returns for Year Ended June 30, 2009
Following Rasmussen and Grinstead (2025)
Correlation
Institutional investors often treat private equity as an “alternative” distinct from public equity, yet when priced at market, listed private equity exhibits a 0.94 correlation with ACWI versus 0.81 for its NAVs, materially reducing its diversifying potential.
Valuation
We also analyze the volatility of the ratio of market value to NAV, sometimes referred to as the private equity discount. These discounts have long been noted and studied. Possible explanations for them relate to investor sentiment, illiquidity, information asymmetry, and systematic risk.[7] (Identifying the impact of factors such as these on the observed discount of listed private equity is, however, beyond the scope the paper.)
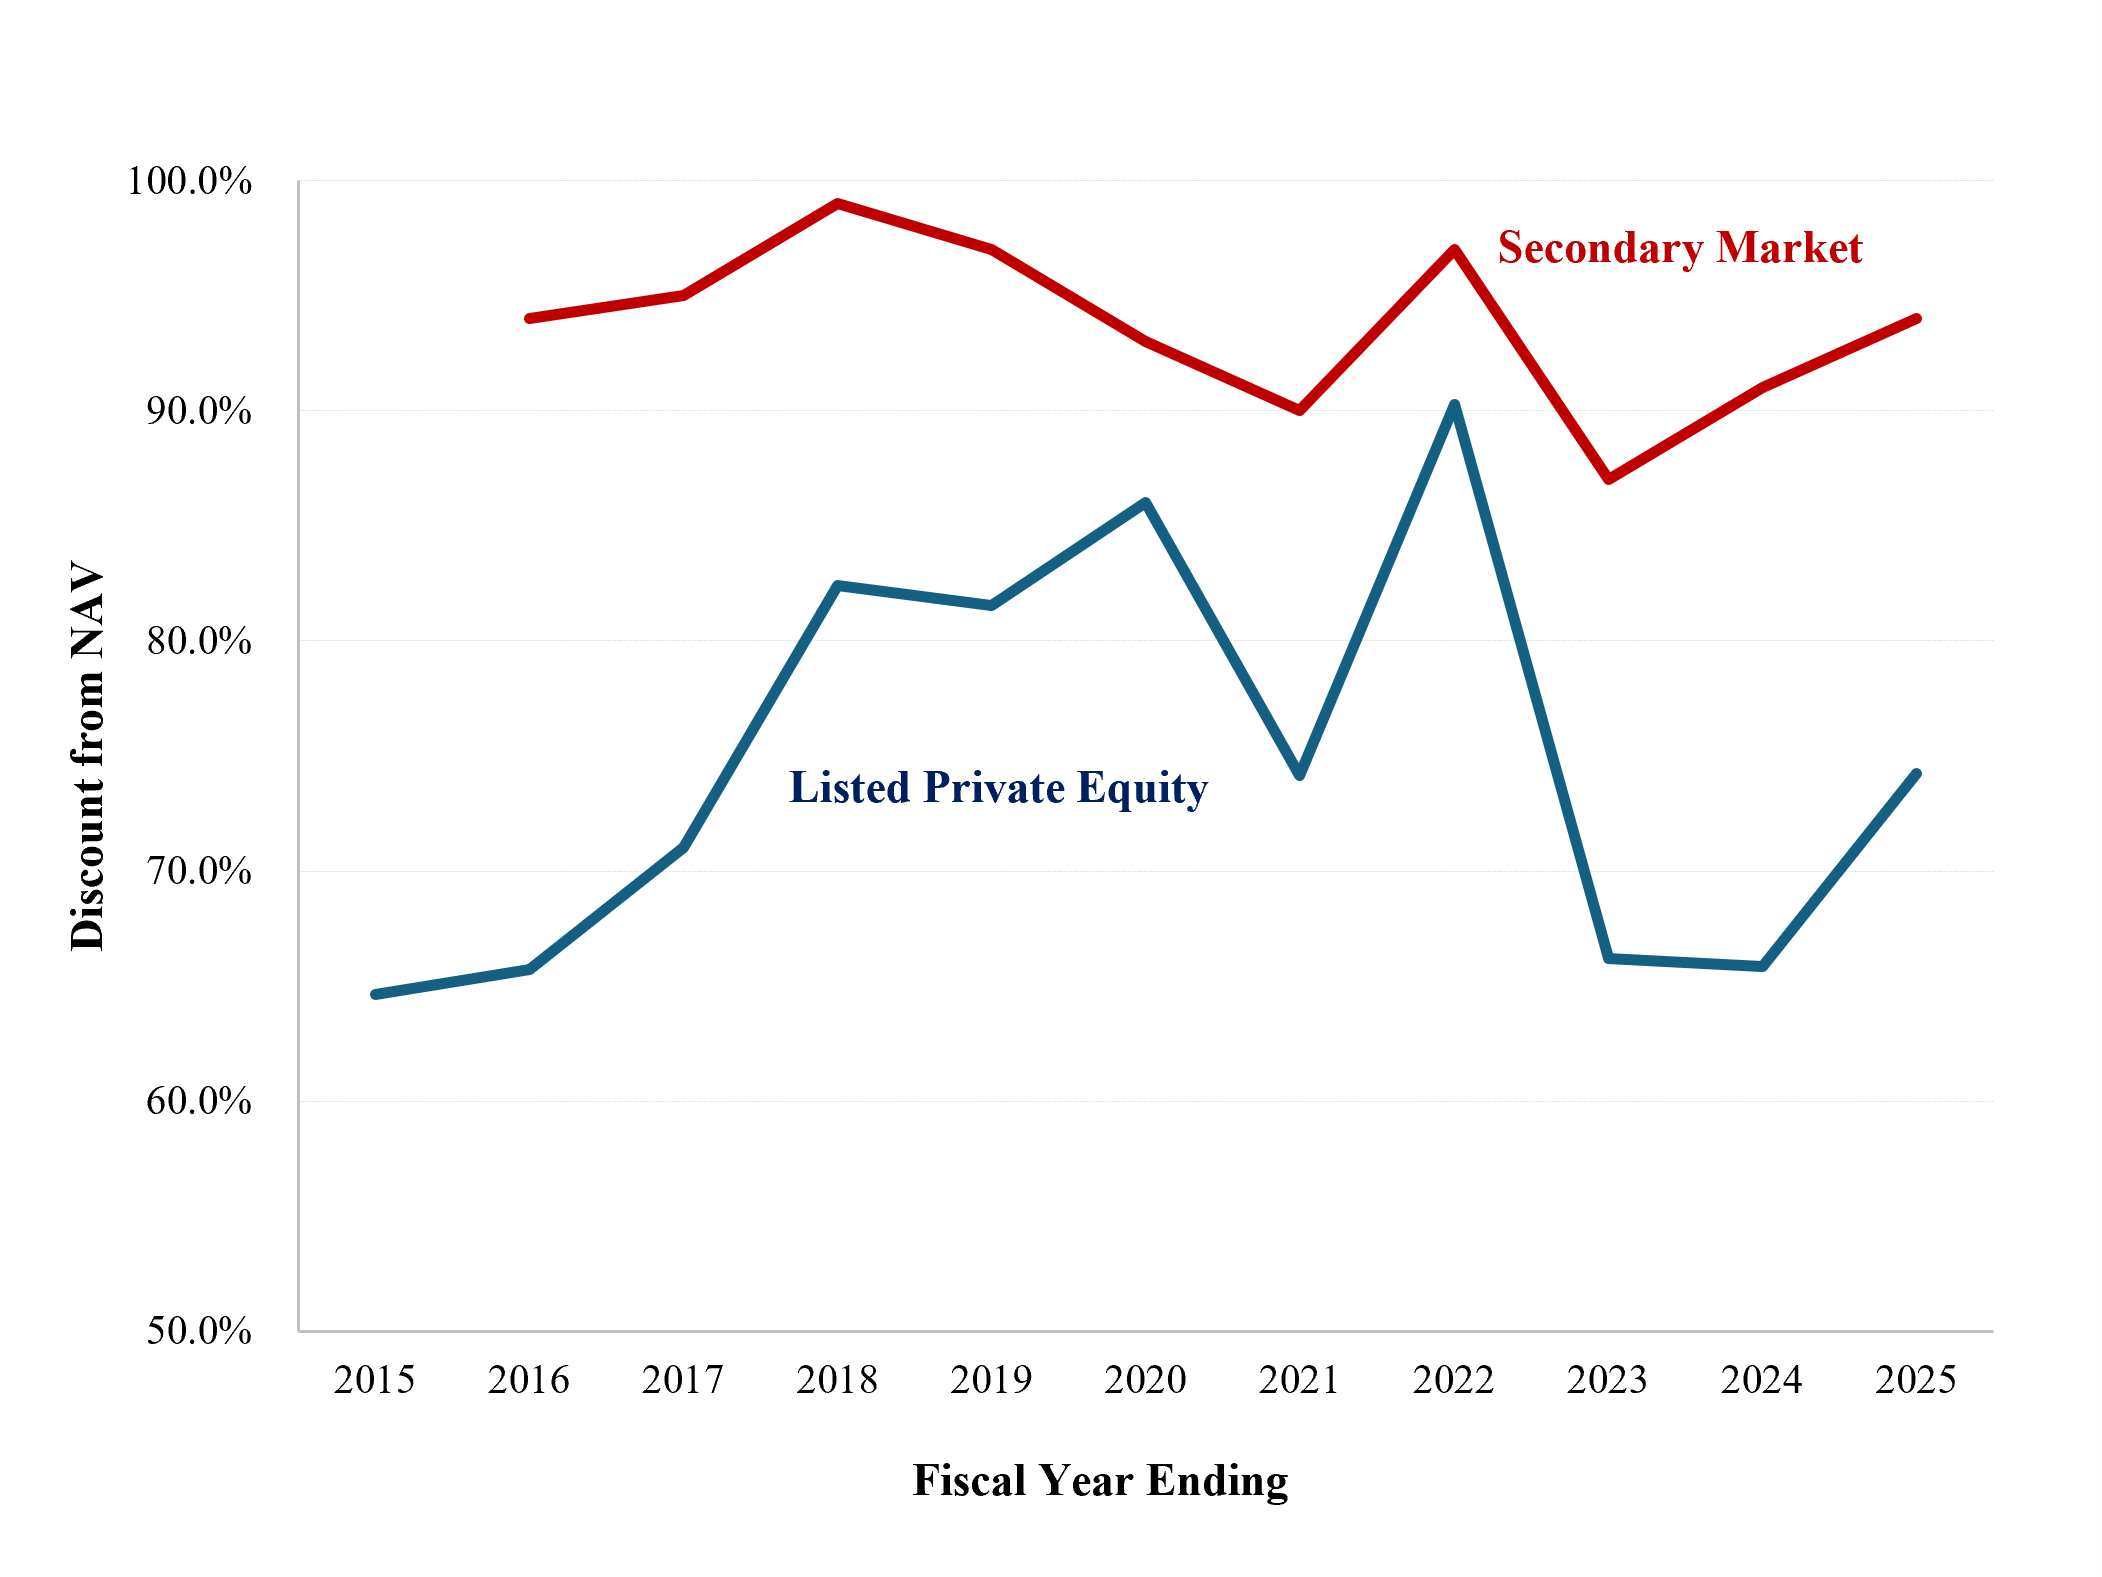
Exhibit 5 shows the variation in NAV discounts based on market pricing of LPE interests as well as secondary-market pricing for the most recent 10 years. The blue line indicates market pricing based on the LPE funds. (The series is market-cap weighted.) The red line shows secondary-market pricing according to Jefferies’s Private Capital Advisory group.[8] Reported secondary-market pricing differs from public-market pricing in two ways. First, the average NAV discount for secondary buyout transactions is rarely greater than 10%. The average discount for market pricing is ~20%, in a range of 10% to 35%. Second, the variability of market-based discounts is greater than for the secondary market.
Exhibit 5
Discount to NAV for Listed Private Equity and Secondary Market Transactions
Sources: Jefferies, Rasmussen and Grinstead
There are reasons to think secondary transactions may give a somewhat favorable picture of private equity valuations. Market participants note that LPs often seek to minimize reported discounts, whether for economic reasons or for “window dressing,” and may carefully select both assets and counterparties to achieve that outcome. Hamilton Lane emphasizes that sellers — especially seasoned institutional LPs — deploy various negotiation strategies and may restrict deal participation to select buyers to obtain the best price possible or reduce the size of the discount.[9] And, of course, sellers decide which assets to offer. So, while secondary market transaction data do offer an indication of the value of unlisted private equity funds, the data may present a biased picture of latent market pricing of private equity interests.
A natural counter‑argument is that buyers in these transactions—typically large, specialized secondary funds—are better informed and may achieve superior pricing than traders in listed shares. The positive performance of secondary funds suggests that their pricing may be closer to fair value, implying that secondary markets could better reflect the marginal clearing price for private assets. Resolving this issue, however, is beyond the scope of this paper.
RISK-ADJUSTED PERFORMANCE
We use the capital asset pricing model (CAPM) and a three-factor model to evaluate the performance of the FPEI. We begin by regressing the FPEI excess returns on those of the MSCI World Index. We very deliberately use annual return data in our analysis. This warrants discussion, for monthly and quarterly return data are used more often in scholarly finance work.
The Choice of Differencing Interval
We use annual differencing in regressions of FPEI on the market index because it better reflects the economics of the problem and the properties of the data. A seminal paper on this issue, Greene and Fielitz (1980), shows that the choice of differencing interval in the analysis of investment returns should be influenced by: (1) the relevant investment horizon and (2) properties of the data under study. G&F maintain that there is no simple default position, e.g., favoring monthly returns because it is the most common practice.
Our goal is to evaluate the long-term — 20-year — performance of LPE as represented by the FPEI, which is to say the relevant horizon is many years. This differs from, say, a goal of developing a short-term trading strategy for liquid securities. In the latter case, daily differencing might be best to benefit from the granularity that is absent in longer intervals. On the other hand, a long differencing interval provides greater opportunity for random short-term fluctuations to average out, with possible loss of model strength as a result of there being fewer observations.
As mentioned earlier, the FPEI comprises small- and micro-cap stocks. These trade thinly and have missing prices and pricing gaps. Thus, the data quality of FPEI is not the same as a portfolio of large-cap stocks. This shows up as noise when regressing FPEI returns on those of the MSCI World index. We demonstrate below that it can take up to two years for random return effects to wash out of a regression involving FPEI returns. These facts indicate that a long differencing interval is better than a short one for our purposes.
Demonstration. We examine regression results using daily, monthly, quarterly, annual and biennial differencing intervals. Exhibit 6 summarizes the results. It compares 20-year regression results for the five intervals. As we lengthen the differencing interval from daily to monthly, quarterly, and annual, the estimated beta rises from 0.4 to 1.5 and the intercept falls from essentially zero to about ‑4.5% per year, while R2 increases from 22% to 91%. At the same time, unexplained variance (“noise”) drops from 78% of total variance at the daily horizon to 9% at the annual horizon and 4% at the biennial horizon. These patterns indicate that short‑interval regressions are dominated by noise and stale prices rather than reflecting the true risk of market‑priced buyout exposure, whereas annual and biennial horizons are more informative for long‑horizon allocators.
Exhibit 6
The Impact of Varying the Differencing Interval
(20 years ended June 30, 2025)
|
|
Daily |
Monthly
|
Quarterly
|
Annual
|
Biennial |
|
Annualized Volatility of FPEI |
16.3% |
19.9% |
26.3% |
27.4% |
29.6% |
|
Correlation with MSCI World Index |
0.47 |
0.79 |
0.88 |
0.96 |
.98 |
|
Beta |
0.40 |
0.93 |
1.28 |
1.47 |
1.55 |
|
Standard Error of Beta |
.010 |
.047 |
.078 |
.106 |
.118 |
|
Intercept (annualized) |
0.01% |
-0.04% |
-0.65% |
-4.49% |
-5.82% (~ -2.9% annualized) |
|
t-Statistic of Intercept |
1.2 |
-0.2 |
-0.9 |
-2.1 |
-3.1 |
|
R2 |
22% |
62% |
77% |
91% |
96% |
|
Noise (Unexplained Variance as a Percentage of Total Variance) |
78% |
38% |
23% |
9% |
4% |
Using biennial differencing doesn’t alter beta much. But it does further decrease the intercept (from -4.5% to -5.8%) and increase R2 — from 91% to 96% — strengthening the model noticeably. At the same time, noise, measured by unexplained variance, decreases by more than half, from 9% to 4%. As noise is further reduced, we observe a statistically significant intercept of -5.8% over two years (t-statistic of -3.1), or about -2.9% annualized. The shorter-interval betas are best viewed as artifacts of noise and stale prices rather than a true indication of low risk. For allocators with 10–20‑year horizons, annual/biennial frequency is closer to how performance judgments are made in practice. A case can be made for using biennial returns in
our 20‑year study of LPE performance, but we settle on annual returns as a balance between noise reduction and sample size.
We also estimated Dimson (1979) betas from the monthly return series, a technique favored by many academics to correct for the effects of infrequent trading and data gaps. For the period covered in Exhibit 6, the Dimson beta is 1.30 — higher than the unadjusted monthly beta of 0.93, but still well short of the 1.47 beta obtained using annual differencing. Model fit similarly improves only partway: R² rises to 70%, versus 60% for the unadjusted monthly series and 91% for the annual specification. The intercept is -0.30% (annualized), statistically indistinguishable from zero (t = -1.4). These results indicate that the Dimson correction moves estimates in the same direction as lengthening the differencing interval — higher beta, alpha near zero — but recovers only part of the effect. We attribute this to the slow price-discovery process evident in the FPEI universe, where explanatory power and the share of variance attributable to noise (Exhibit 6) continue to improve materially out through the biennial interval, beyond the lead/lag structure a monthly Dimson correction is designed to capture. We therefore use annual differencing as the interval that best matches both the underlying data properties and the long investment horizon relevant to buyout investors, following Greene and Fielitz (1980).
CAPM Results
Exhibit 7 illustrates principal CAPM performance evaluation results for the FPEI excess returns regressed on those of the MSCI World index over 20 years.The FPEI beta is 1.6 with standard error of 0.14. This implies that market‑priced buyout exposure is roughly 60% more volatile than the global equity market, in line with the greater use of financial leverage relative to typical public companies.[10] Risk-adjusted performance, or alpha, is -4.2%, annualized, with a not-significant t-statistic of -1.7.
Exhibit 7
Annual FPEI Excess Returns Regressed on MSCI World Index Excess Returns
(20 years ended June 30, 2025)
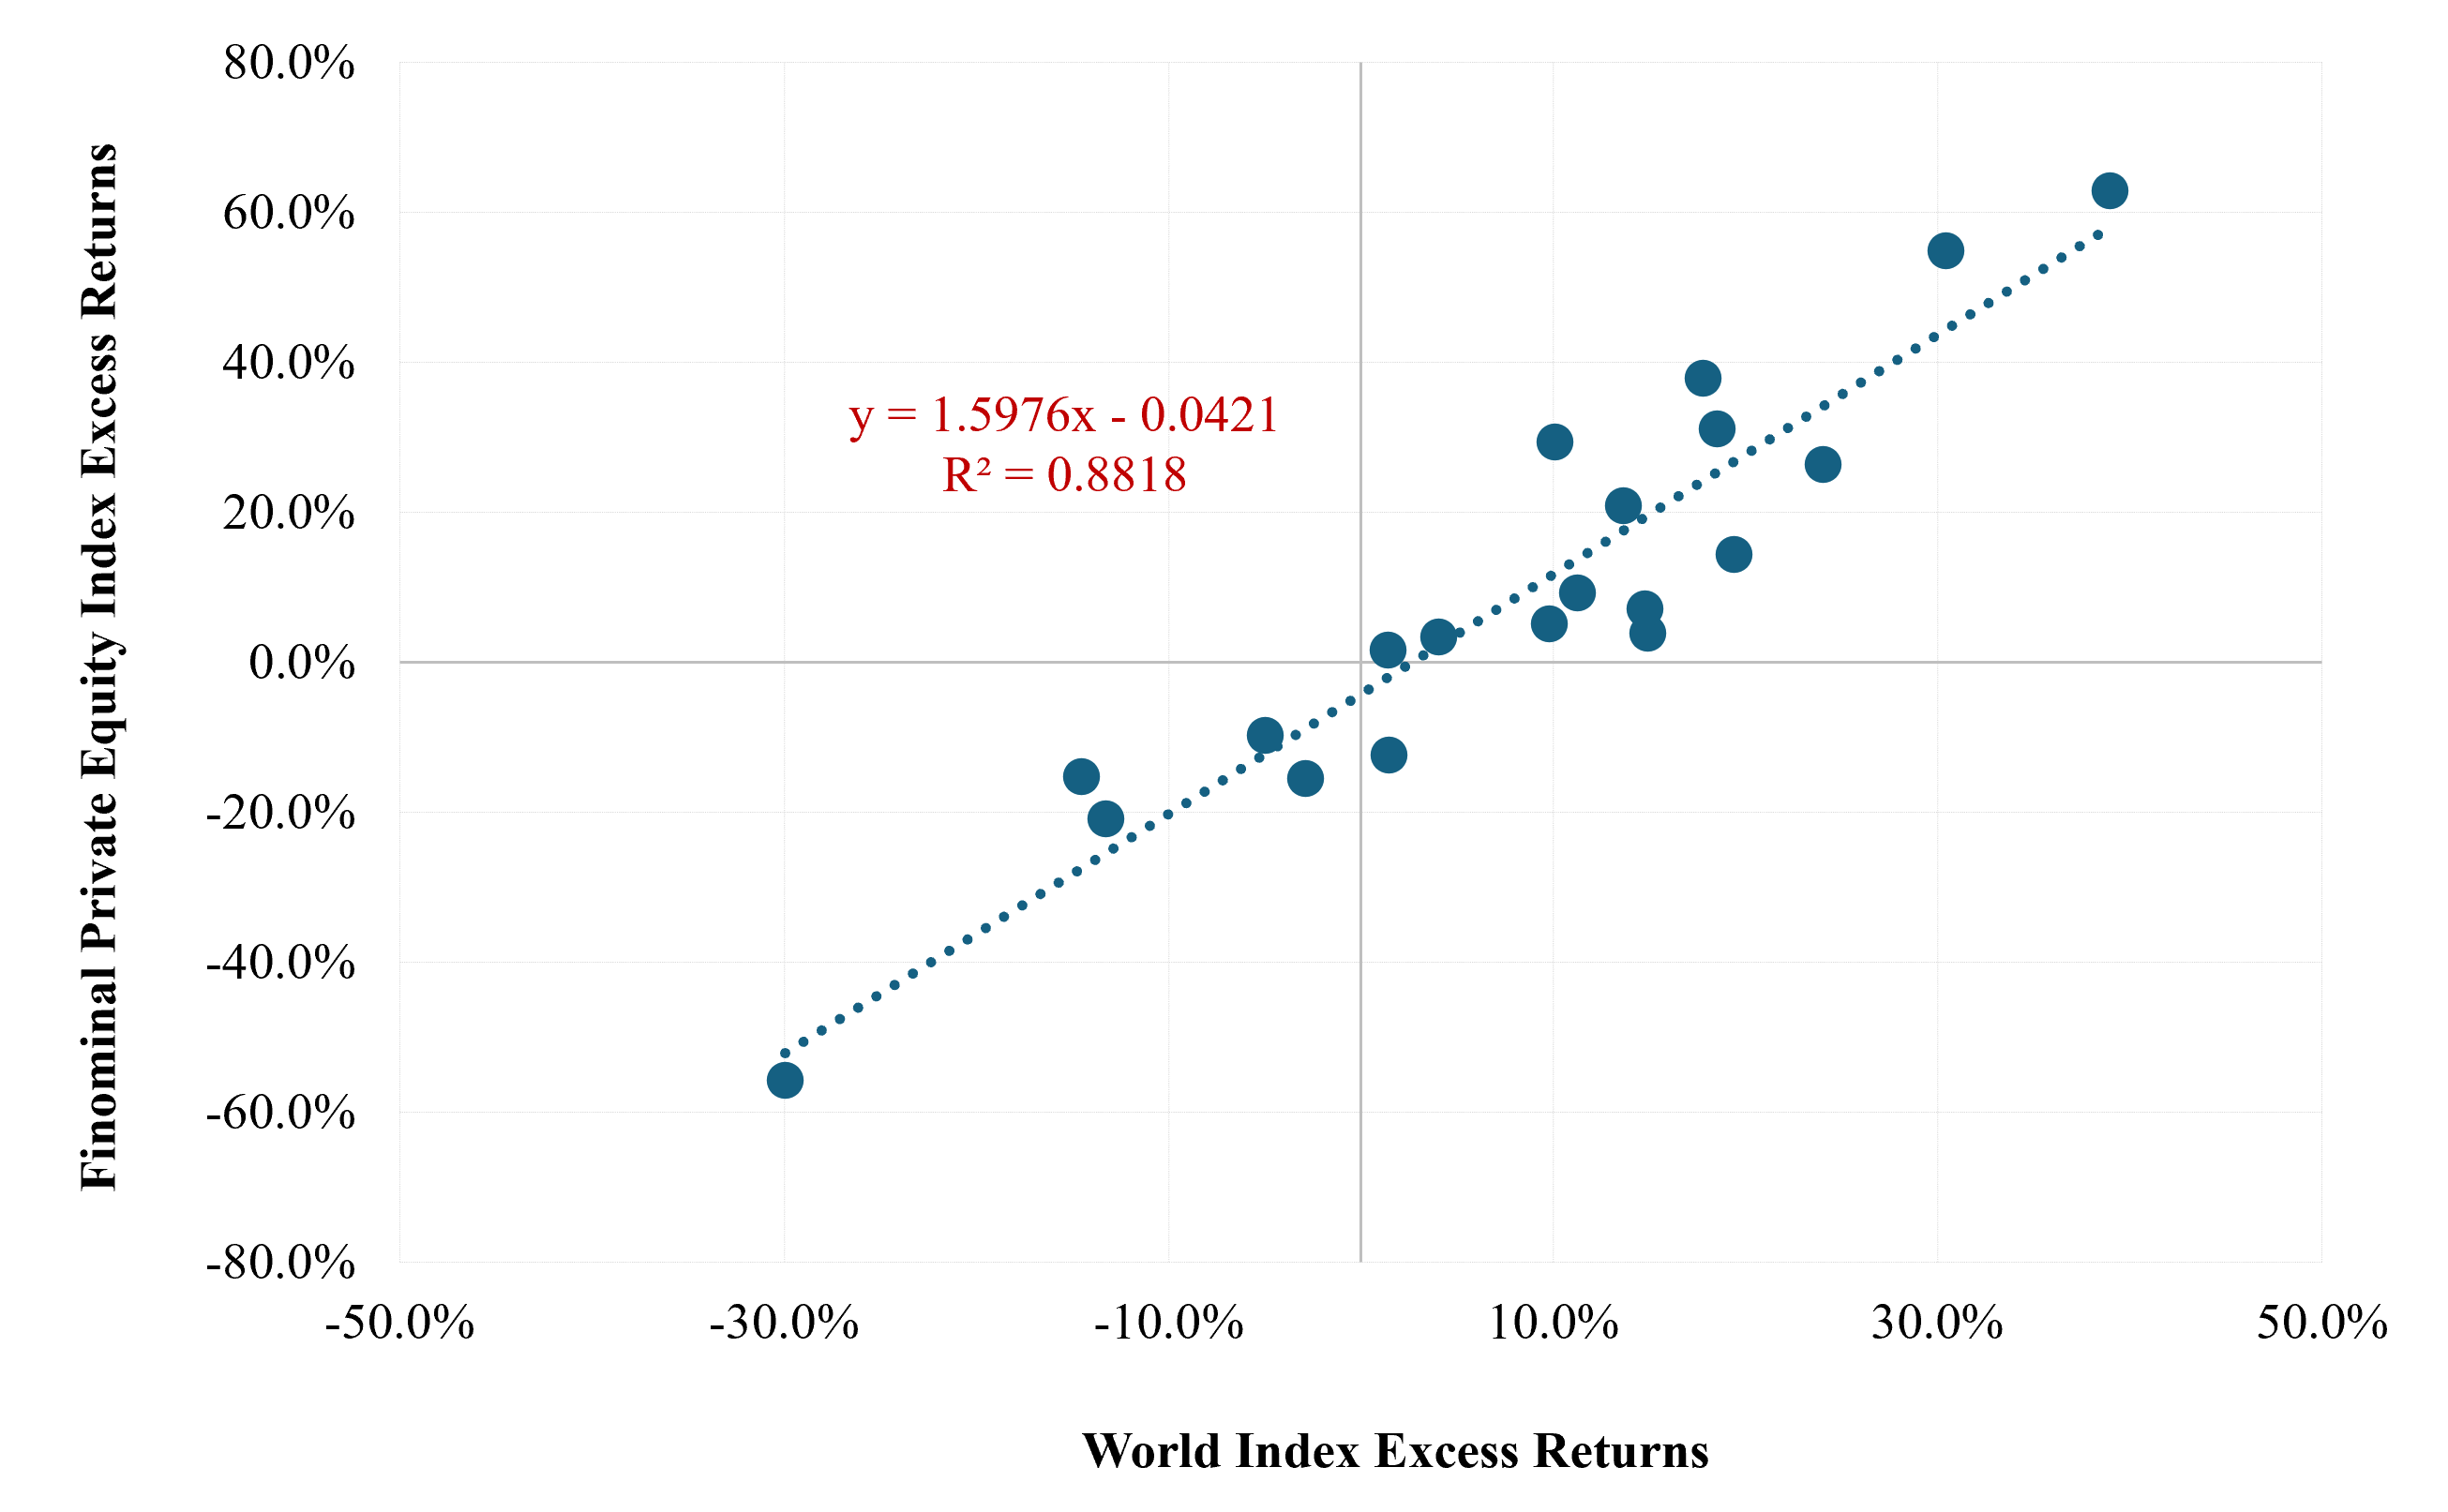
The R2 of FPEI with the MSCI World Index is 88%, indicating the strong connection between private equity and publicly traded stocks when private equity assets are valued in competitive markets rather than by fund sponsors.[11]
Rolling 10‑year regressions show stable betas in the 1.5–1.9 range and no positive alpha in any window; all intercepts are negative and generally indistinguishable from zero. We see no evidence of endpoint bias or model instability, which is reassuring given the small sample and incomplete histories. See Exhibit 8.[12] The CAPM with annual returns appears to be a sturdy, if imperfect, model for examining the performance of buyout investments.
Exhibit 8
Rolling Decades of FPEI Performance
|
Decade Ended June 30 |
Beta |
Standard Error of Beta |
Intercept |
Intercept t-statistic |
R2 |
|
2015 |
1.6 |
0.17 |
-2.5% |
-0.8 |
92% |
|
2016 |
1.6 |
0.18 |
-3.5 |
-1.0 |
91 |
|
2017 |
1.8 |
0.15 |
-1.4 |
-0.5 |
95 |
|
2018 |
1.8 |
0.17 |
-2.9 |
-0.9 |
93 |
|
2019 |
1.8 |
0.26 |
-3.3 |
-0.8 |
86 |
|
2020 |
1.9 |
0.23 |
-6.9 |
-2.0 |
89 |
|
2021 |
1.8 |
0.19 |
-6.4 |
-2.0 |
91 |
|
2022 |
1.6 |
0.20 |
-3.6 |
-1.0 |
89 |
|
2023 |
1.5 |
0.24 |
-5.0 |
-1.2 |
84 |
|
2024 |
1.5 |
0.26 |
-5.5 |
-1.2 |
80 |
|
2025 |
1.5 |
0.26 |
-6.6 |
-1.4 |
81 |
Tests of the Relevance of FPEI
It is not possible to truly validate the FPEI given the amorphous nature of the universe of private equity. The earlier discussion summarizes our view that it is well constructed, despite its lack of breadth. We perform two additional experiments to test the suitability of FPEI for our purposes.
Three-Factor-Model Results. We employ a three-factor model that incorporates Fama-French size and value factors.[13] The factor loadings are consistent with results reported for private equity in prior studies, e.g., Wen and van Beek (2025), which supports the interpretation of the FPEI as an indicator of private equity exposure. Exhibit 9 summarizes the main results, with t-statistics in parentheses. The size and value factors, while present, are not significant at the 5% level. Although not a formal validation test, the familiar size and value exposures and the modest increase in explanatory power (R2 from 88% to 91%) are directionally supportive of treating FPEI as a reasonable proxy for buyout exposure.
Exhibit 9
Three-Factor Performance Analysis
(20 years ended June 30, 2025, t-statistics in parentheses)
|
Model |
Market Factor |
Small (SMB) |
Value (HML) |
Alpha |
R2 |
|
Three Factors |
1.5 (11.0) |
0.20 (0.7) |
0.40 (1.9) |
-3.0% (-1.2)
|
91%
|
|
CAPM Using MSCI World Index
|
1.6 (11.6) |
- |
- |
-4.2 (-1.7) |
88% |
Correlation of Residuals. We compare the residual returns of FPEI with those of the IRR-based PitchBook Global Private Equity Index. We accomplish this by regressing returns for both indexes against the MSCI World Index for the 20 years of this study and then determining the correlation of the residuals. We observe a residual correlation of 0.32, indicating that the two series exhibit an association of moderate strength after removing market effects.
The results of these tests are not proof that FPEI is a valid index of buyout performance, but they support using it in this context.
STATE OF THE ART
Early Work
Others have examined the performance of publicly-traded private equity. The results of early work generally comport with our principal conclusion, namely, that the beta of LPE is ~1.5 and alpha is not different than zero. Bilo et al. (2005) was a pioneering effort. It employs a large, diverse dataset, including venture capital funds and sundry private equity stocks. It uses weekly returns and generates a noisy regression. The endpoint of the study is 2003. Lahr (2010) studies over 500 listed private equity vehicles and estimates CAPM-Dimson betas. It finds an aggregate beta around 1.7 and no significant abnormal return. While our results are consistent with Bilo and Lahr, our paper differs from these foundational works primarily in its focus on listed leveraged buyout funds via FPEI. And it's more up to date, of course, with results through 2025.
The Secondary Market
The secondary market for private assets accommodates trading in venture capital, buyouts, real estate, private credit, and infrastructure. Secondary transaction volume reached about $226 billion in 2025, up 41% from the prior year. Both traditional asset managers and private equity firms are launching dedicated funds to capture this flow. All indications are that secondary activity will continue to grow in the years ahead.
Two scholarly studies examine the performance of private equity based on secondary market transactions: Boyer et al. (2023) and Godwin (2022). The stylized facts of the two papers, along with ours, are summarized in Exhibit 10. Buyout volatility in the secondary market is roughly in the range of 30% to 40%, much greater than customarily reported for NAVs and buyout fund returns. Betas in the secondary market range from 1.8 to 2.1, whereas studies based on cash flows and NAVs often report betas of not more than about 1.0. None of the alphas is significantly different from zero. Performance results from the secondary market are broadly consistent with ours: higher volatility and betas around 1.8–2.1, with alphas not significantly different than zero.
Exhibit 10
Summary Statistics for Publicly Traded Private Equity Interests
|
|
Boyer et al. (2023) |
Godwin (2022) |
Ennis & Rasmussen (2026) |
|
Study Period |
2006 - 2018 |
2004-2020 |
2005-2025 |
|
Venue |
Secondary Market |
Secondary Market |
Various Stock Exchanges |
|
Volatility |
34% |
42% |
27% |
|
Beta |
1.8 |
2.1 |
1.6 |
|
Alpha |
-2.0% |
2.1% |
-4.2%
|
|
R2 |
69% |
63% |
88% |
As for future research, the rapidly growing secondary market may ultimately become the primary venue for observing private equity performance under competitive pricing.
DISCUSSION AND CONCLUSION
Our thesis is straightforward: If observed buyout volatility and beta are no greater than those of the public market, these highly levered investments can appear to generate significant alpha. Once we incorporate market pricing of underlying assets, both volatility and beta rise materially. For listed private equity, we estimate a beta of roughly 1.5 and find no statistically meaningful alpha.
The scope of our fund sample is modest, but we believe a reasonable degree of confidence in our beta and alpha estimates is warranted, for four reasons.
Sound Index Construction. Earlier we described key aspects of FPEI’s composition and construction. It comprises only closed‑end buyout funds, is market‑cap weighted, and is free of survivorship bias. We do not identify any obvious compositional or construction flaws.
Tests of the Relevance of FPEI. We observe value and small‑cap factor exposures for FPEI that are familiar from the private equity literature, and we find a moderately positive residual correlation with a conventional IRR‑based index (PitchBook) after controlling for the market. Neither result proves that FPEI is a perfect benchmark for buyout performance, but together they support interpreting the index as indicative of the behavior of buyout funds.
Theory. Proposition 2 of Modigliani and Miller (1958), under its simplifying assumptions, implies that the cost of equity rises in proportion to leverage. Axelson, Sørensen, and Strömberg (2014), for example, show that a simple M&M application with a 3:1 debt‑to‑equity ratio can produce a buyout equity beta in the range of 2–3, even allowing for debt beta greater than zero. Several authors offer reasons why “true” private equity beta might fall below that level, and those arguments have merit. Our reading of the literature, however, does not justify reducing the beta of buyouts to 1 or below. Two criticisms of the low‑beta studies are particularly compelling: some measure the wrong object (limited partner net cash flows rather than gross levered equity), and others are exposed to measurement error from smoothed, stale, or model‑dependent inputs.
Secondary‑Market Evidence. Independent evidence from the secondary market points in the same direction. Buyout volatility in secondary transactions is on the order of 30%–40%, far higher than is typically reported for NAV‑based buyout fund returns. Estimated betas in this market range from 1.8 to 2.1, and alphas are not significantly different than zero.
This article is not a comprehensive review of private equity performance. Its narrower aim is to shed light on the “beta puzzle” of private equity: how published estimates of beta can diverge so sharply from basic leverage intuition. The rapidly growing secondary market may ultimately become the primary venue for observing private equity performance under fully competitive pricing. In the meantime, publicly-traded private equity funds already provide a useful window into the economics of buyout investing when assets are valued at market rather than at sponsor‑reported NAVs.
The results we report have direct implications for long‑horizon investors and policy‑makers. They bear on strategic asset allocation, the design of performance benchmarks, and the calibration of risk models that treat private equity as both high‑return and diversifying. As the cost, opacity, complexity, and performance of private-asset investing face increasing scrutiny, this is an opportune moment for institutions to reassess rising allocations to buyouts and other private assets in light of economic reality rather than the reassuring narratives that often surround them.
ACKNOWLEDGEMENTS
We gratefully acknowledge helpful comments of anonymous reviewers, Andrew Ang, Gregory Brown, Antti Ilmanen, Steven Kaplan, Ludovic Phalippou, Nicolas Rabener, Trym Riksen, William Sharpe, and William Volckmann.
REFERENCES
Asness, C. 2023. “Why Does Private Equity Get to Play Make-Believe With Prices?” Institutional Investor (January 6).
Axelson, U., M. Sorensen, and P. Stromberg. 2014. “Alpha and Beta of Buyout Deals: A Jump CAPM for Long-Term Illiquid Investments.” Working paper at https://personal.lse.ac.uk/axelson/ulf_files/alpha%20and%20beta%201.pdf
Bilo, S., H. Christopher, M. Degosciu, and H. Zimmermann. 2005. “Risk, Returns, and Biases of Listed Private Equity Portfolios.” University of Basel, WWZ/Department of Finance, Working Paper No. 1/05.
Boyer, B. H., T.D. Nadauld, K. Vorkink, and M. Weisbach. 2023. “Discountâ€ÂRate Risk in Private Equity: Evidence from Secondary Market Transactions,” The Journal of Finance 78, 835–885.
Brown, Gregory W., Andrei S. Gonçalves, and Wendy Hu. 2024. "The Private Capital Alpha." Fisher College of Business Working Paper No. 2024-03-020. Available at SSRN: https://ssrn.com/abstract=4967890.
Dimson, Elroy. 1979. "Risk Measurement When Shares are Subject to Infrequent Trading." Journal of Financial Economics, 7(2), 197–226.
Finominal. 2025. “Private Equity Without the Lag.” https://finominal.com.
Gensler, G. 2021. Testimony Before the Subcommittee on Financial Services and General, U.S. Government, U.S. House Appopriations Committee. At https://www.sec.gov/newsroom/speeches-statements/gensler-2021-05-26.
Godwin, A. 2022. "Estimating Illiquid Asset Class Alpha and Beta using Secondary Transaction Prices." MPRA Paper 112510, University Library of Munich, Germany.
Hamilton Lane, "The Truth About Secondaries: Separating Myth from Market Opportunity," July 16, 2025.
Harris, R.S., T. Jenkinson, S.N. Kaplan, and R. Stucke. 2023. “Has Persistence Persisted in Private Equity? Evidence from Buyout and Venture Capital Funds.” Journal of Corporate Finance, Volume 81.
Ilmanen, A., S. Chandra, and N. McQuinn. 2020. “Demystifying Illiquid Assets:Expected Returns for Private Equity.”The Journal of Alternative Investments.
Jefferies Private Capital Advisory. January 2021 and 2025. “Global Secondary Market Review.”
Jenkinson, T., H. Kim, and M. Weisbach. 2021. “Buyouts: A Primer.” NBER Working Paper No. w29502, Available at SSRN: https://ssrn.com/abstract=3968725.
Korteweg, Arthur, and Stefan Nagel. 2024. "Risk-Adjusted Returns of Private Equity Funds: A New Approach." The Review of Financial Studies, 38(9), 2557–2601.
Lahr, Henry. 2010. "Pricing of Listed Private Equity." (PhD thesis, Technical University of Munich).
Lahr, H. and C. Kaserer. 2010. “Net Asset Value Discounts in Listed Private Equity Funds.” CEFS Working Paper No. 2009-12, Available at SSRN: https://ssrn.com/abstract=1494246
or http://dx.doi.org/10.2139/ssrn.1494246.
Lim, W. 2024. “Accessing Private Markets: What Does It Cost?” Financial Analysts Journal, 80(4), 27–52.
Modigliani, F. and M.H. Miller. 1958. “The Cost of Capital, Corporation Finance and the Theory of Investment.” The American Economic Review, 48, 261-297.
Phalippou, L., and O. Gottschalg. 2009. “The Performance of Private Equity Funds.” The Review of Financial Studies 22 (4): 1747–1776.
PitchBook. “Global Private Equity Index, 4Q 2024.” https://pitchbook.com/tag/pitchbook-benchmarks
Rasmussen, D. and J. Grinstead. 2025. “When Private Funds Are Publicly Traded.” Verdad Capital: https://verdadcap.com/archive/when-private-funds-are-publicly-traded.
Scharf, D. 2021. ”GP-Led Transactions: What LPs Need to Know.” Hamilton Lane,
September 23.
S&P Dow Jones Indices. “S&P Listed Private Equity Index.” July 31, 2025. At
https://www.spglobal.com/spdji/en/idsenhancedfactsheet/file.pdf?calcFrequency=M&force_download=true&hostIdentifier=48190c8c-42c4-46af-8d1a-0cd5db894797&languageId=1&indexId=92479391.
Wen, C. and and M. van Beek. 2025. “A Latent Factor Cash Flow Model for Alternative Investment Funds.” Financial Analysts Journal, 60-75.
[1] The cost of buyout investing is estimated to be at least 6% of asset value per year. See Phalippou and Gottschalg (2009), Jenkinson et al. (2021), and Lim (2024).
[2] This paper was inspired by Rasmussen and Grinstead (2025), which examined risk characteristics of shares listed on the London Stock Exchange.
[3] See Gensler (2021).
[4] S&P Dow Jones Indices (2025).
[6] Courtesy of the Institute of Private Capital, Kenan-Flagler Business School, University of North Carolina at Chapel Hill.
[7] See, for example, Lahr and Kaserer (2010).
[8] The data are not strictly comparable. Jefferies’ reported discounts are deal-weighted averages over time while the LPE discounts are point-in-time market-cap weighted.
[9] See Hamilton Lane (2025) and Scharf (2021).
[10] LBO debt has typically amounted to 60-70% of asset value at acquisition. The debt of ACWI companies is in the range of 20-30% of assets.
[11] We also analyze the CAPM performance of FPEI using the Russell 3000 stock index. This results in a slight worsening of performance. The beta of 1.6 is the same as reported in Exhibit 7 for MSCI World. R2 declines to 85% from 88%. Alpha declines to -7.1% with a t-statistic of -2.5. Owing to the global character of FPEI assets, however, we continue to believe the MSCI World Index is the more appropriate total stock market benchmark.
[12] These regressions are of total return rather than excess return in the interest of simplicity.
[13] The source of factor returns is Kenneth French’s website. They are figures for developed markets. https://mba.tuck.dartmouth.edu/pages/faculty/ken.french/Data_Library/f-f_3developed.html