Institutional Investment Strategy and Manager Choice: A Critique
May 18, 2020 by Richard M. Ennis
Abstracted from Journal of Portfolio Management, Fund Manager Selection Issue, 2020
There is a dearth of research on the performance of pension and endowment funds. One reason is that it is well-nigh impossible to get your hands on good, publicly-available data on the rates of return, asset allocation and costs of institutional funds. In this regard, three cheers for the Center for Retirement Research at Boston College, which, with its Public Plans Data database of public pension funds, is doing a great job of locating and putting up data if you are willing to work a little to get what you want. And one cheer for Nacubo, which publicly posts scant but welcome data on educational endowments. (As the song lyrics go, A little bit is better than nada....)Table 1
These are noteworthy results. For a decade, stock and bond indexes have captured the return-variability characteristics of alternative investments in composites of institutional funds, for all intents and purposes. Alternative investments did not have a meaningful impact. The finding that the correlation between funds with significant alts exposure and marketable securities benchmarks is near-perfect runs counter to the popular notion that the return properties of alts differ materially from those of stocks and bonds. That, after all, is an oft-cited reason for incorporating alternative investments in institutional portfolios. But as we see here, alt returns simply blend into broad market returns in the context of standard portfolio analysis in the latter decade.
Public pension funds exhibit diversification in the extreme. The median R2 of 46 individual funds is 98.5%. With that degree of diversification and a typical cost of investing of 1% of assets (see below), the vast majority are expected to underperform properly constructed passive benchmarks in the years ahead.Figure 1
Next, I performed a cross-sectional analysis of the performance of the 46 individual public pension funds. I created a unique equivalent-risk benchmark for each by regressing the individual fund returns on those of the factor benchmark for the public fund composite. One of the 46 funds has a statistically significant positive alpha. Seventeen have statistically significant negative alphas. The median alpha is -1.03%.
The margin of underperformance of public funds, collectively, is nearly identical to investment their expense level. I estimated the latter, independently of fund performance, to be 98 bps of asset value.Figure 2
1 The benchmark affords the best fit with the composite returns employing three indexes. They are Russell 3000 (53%), MSCI ACWI ex-U.S. (17%) and Bloomberg Barclays Aggregate Bonds (30%).
There is a dearth of research on the performance of pension and endowment funds. One reason is that it is well-nigh impossible to get your hands on good, publicly-available data on the rates of return, asset allocation and costs of institutional funds. In this regard, three cheers for the Center for Retirement Research at Boston College, which, with its Public Plans Data database of public pension funds, is doing a great job of locating and putting up data if you are willing to work a little to get what you want. And one cheer for Nacubo, which publicly posts scant but welcome data on educational endowments. (As the song lyrics go, A little bit is better than nada....)
Diversification
The first thing I did was to analyze the diversification patterns of composites of public pension and endowment fund returns that I created. (Alternative investments, by the way, account for nearly 30% of public fund assets and 60% of large educational endowments.) I employed two diversification measures: R2 and the standard error of the regression (tracking error). I performed returns-based style analysis on the composite returns five times, sequentially, broadening the number of possible explanatory variables by one with each successive iteration. I started with just two indexes, those for U.S. stocks and U.S. bonds. I then made additional potential explanatory variables (indexes) available one at a time. I report diversification measures for each iteration in Table 1. The first row of the table illustrates the powerful influence of diversifying beyond stocks and bonds in the decade from July 1999 through June 2008. The R2 rose from 0.75 to 0.97 and tracking error decreased from nearly 6% to 2% with the inclusion of alternative investments. In the decade that followed, however, alternatives had a negligible impact on endowment diversification, with the R2 already at 0.99 with global stocks and bonds alone (Column 2). The same pattern exists for public pension funds during the more recent 10-year period ending June 30, 2018. (Ten years of historical return data for the pension funds are not available for the prior period.)Table 1
Patterns of Diversification of Institutional Funds During Two Decades:
R2 and Tracking Error
| 1. U.S. Stocks and Bonds Only |
2. Admit Non-U.S. Stocks |
3. Admit Real Estate |
4. Admit Private Equity |
5. Admit Hedge Funds |
|
| Endowment Funds, 1999-2008 |
.66 (6.7%) |
.75 (5.7%) |
.75 (5.7%) |
.91 (3.4%) |
.97 (2.0%) |
| Endowment Funds, 2009-2018 |
.98 (1.6%) |
.99 (1.5%) |
.99 (1.5%) |
.99+ (0.8%) |
.99+ (0.5%) |
| Public Pension Funds, 2009-2018 |
.99+ (1.1%) |
.99+ (0.9%) |
.99+ (0.9%) |
.99+ (0.6%) |
.99+ (0.6%) |
These are noteworthy results. For a decade, stock and bond indexes have captured the return-variability characteristics of alternative investments in composites of institutional funds, for all intents and purposes. Alternative investments did not have a meaningful impact. The finding that the correlation between funds with significant alts exposure and marketable securities benchmarks is near-perfect runs counter to the popular notion that the return properties of alts differ materially from those of stocks and bonds. That, after all, is an oft-cited reason for incorporating alternative investments in institutional portfolios. But as we see here, alt returns simply blend into broad market returns in the context of standard portfolio analysis in the latter decade.
Public pension funds exhibit diversification in the extreme. The median R2 of 46 individual funds is 98.5%. With that degree of diversification and a typical cost of investing of 1% of assets (see below), the vast majority are expected to underperform properly constructed passive benchmarks in the years ahead.
Public Fund Performance and Cost
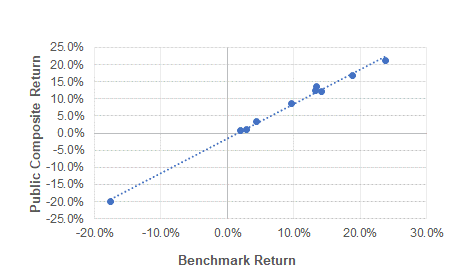
Figure 1 illustrates a regression of the public pension fund composite returns on a 70-30 stock-bond benchmark.1 The public fund composite’s beta relative to benchmark is 1.003, indicating market-like volatility. The intercept of the simple regression is a measure of risk-adjusted performance (alpha). The alpha of public funds as measured by the intercept in Figure 1 is -0.98% per year. The alpha has a standard error of 0.39% and a t-statistic of -2.5, indicating its statistical significance. The R2 of the regression is 0.993 The standard error of the regression (tracking error) is 1.0%, which is minuscule relative to the full range of composite outcomes of more than 40-percentage points. The regression statistics reinforce the earlier finding that public securities markets have become the essential drivers of institutional portfolio return and reveal underperformance of approximately 100 bps per year.Figure 1
Regression of Composite Public Pension Fund Returns
on Factor Benchmark Returns
(10 years ended June 30, 2018)
Next, I performed a cross-sectional analysis of the performance of the 46 individual public pension funds. I created a unique equivalent-risk benchmark for each by regressing the individual fund returns on those of the factor benchmark for the public fund composite. One of the 46 funds has a statistically significant positive alpha. Seventeen have statistically significant negative alphas. The median alpha is -1.03%.
The margin of underperformance of public funds, collectively, is nearly identical to investment their expense level. I estimated the latter, independently of fund performance, to be 98 bps of asset value.
Impact of Alternatives on Total Fund Performance
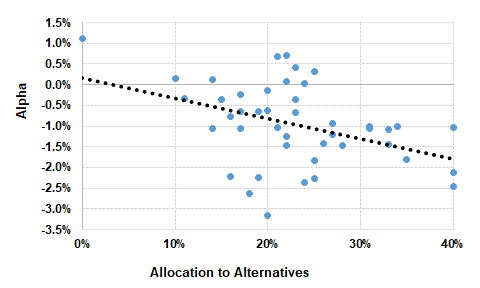
I regressed the individual public fund alphas discussed above on the funds’ respective average percentage allocation to alternative investments (real estate, private equity, and hedge funds) during the study period. I wanted to know if alternative investments had a discrete, discernible effect on institutional performance. And indeed there has been such an effect, despite the very coarse nature of the metric employed for alternative investments, namely, a simple basket-percentage of the three types of alts. Figure 2 indicates the adverse impact of alternative investments on public pension fund performance as measured by alpha for 44 large public funds for the 10 years ended June 30, 2018. The slope is -0.049 with a statistically significant t-statistic of -2.9. It indicates that a reduction in alpha of nearly 200 basis points relative to marketable securities alone is associated with a 40% allocation to alts. In other words, alternative investments proved to be a serious drag on institutional fund performance during the study period.Figure 2
Alpha vs. Exposure to Alternative Investments
(10 Years ended June 30, 2018)
Bottom Line
Given the degree of institutional fund diversification, the diminished role of alternatives, and prevailing cost structure, institutional investors face the prospect of continuing significant underperformance in the years ahead. It is time to rethink institutional investment strategy.1 The benchmark affords the best fit with the composite returns employing three indexes. They are Russell 3000 (53%), MSCI ACWI ex-U.S. (17%) and Bloomberg Barclays Aggregate Bonds (30%).

